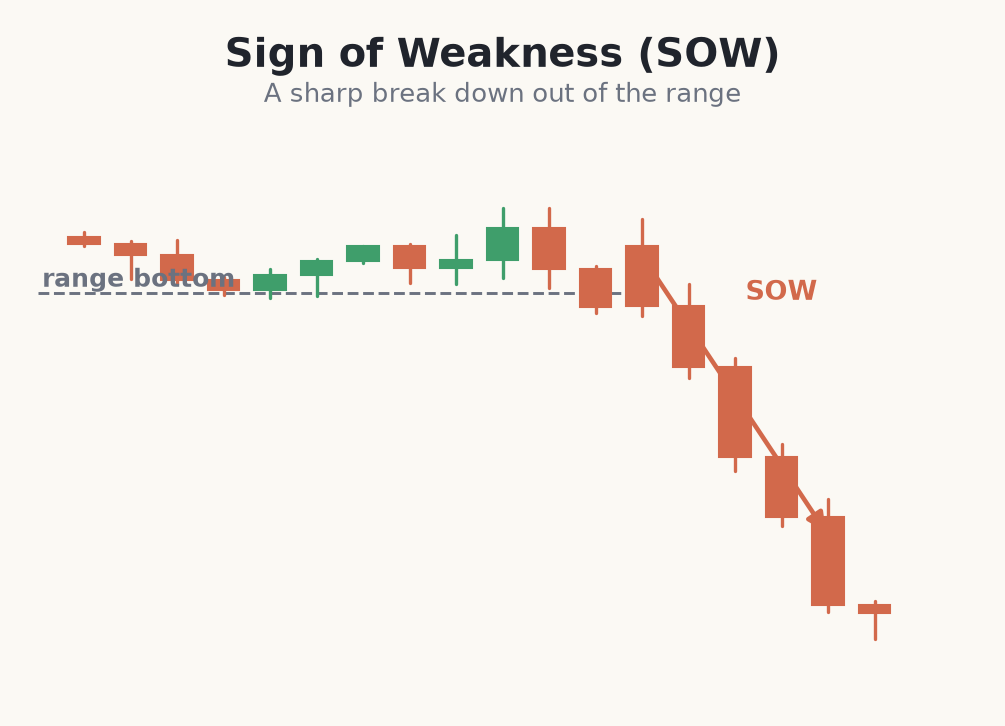
A sign of weakness, or SOW, is the mirror of the SOS: a decisive break down out of a distribution range on expanding volume and wide down-candles. It confirms that supply has finally overpowered demand.
What makes it convincing
A genuine SOW shows effort and result agreeing to the downside: heavy volume and wide spread driving price clearly below the range lows, with demand unable to defend support. It typically breaks prior swing lows, flipping structure from sideways to down.
The weak rally that follows is often the last point of supply (LPSY) — a lower high that fails on light volume beneath the broken support. That failed bounce frequently offers a lower-risk short than selling the initial break.
How to trade the LPSY instead of the breakdown
Selling the SOW bar means shorting an extended down-candle with your stop far above — poor reward-to-risk. The disciplined play is to wait for the LPSY: the first bounce that fails below the broken range floor on thinning volume. You short there with a stop just above the lower high, which sits much closer than a stop above the whole range. The market has already proven supply won by breaking down; you are just getting a cheaper entry.
Shorting the last point of supply after an SOW
- 1A stock distributes between €70 and €75. A wide bar breaks €70 to €68.60 on volume triple the average — a clear sign of weakness. You do not chase it.
- 2Price bounces over the next few days to €69.70 on light volume and stalls below the old range floor — the last point of supply, a lower high.
- 3You short at €69.50 as the bounce fails and price rolls back down.
- 4Stop above the LPSY at €70.80. Risk = €1.30 per share — a close there means the breakdown is failing.
- 5Account €1,000, risk 1% = €10. €1.30 risk per share sizes to 7 shares (short). The €5 cause projects toward ~€65, roughly 3.5:1.
- 6Rule: a daily close above €70.80 and you cover — an SOW confirms weakness but never guarantees the markdown continues.
A sign of weakness is a wide, high-volume break down out of the range — supply confirming the start of a possible markdown.
Common beginner mistakes with the sign of weakness
- Chasing the breakdown bar. Shorting the wide SOW candle puts your stop far above and sells the low tick. The LPSY bounce offers a tighter, cheaper entry.
- Accepting a low-volume 'SOW'. A break lacking expanding volume and wide spread is weak and prone to snapping back into the range as a spring. Demand the effort.
- Trusting the SOW to guarantee a downtrend. Breakdowns fail and turn into springs. An SOW shifts odds; it does not remove the need for a stop.
- Missing that the LPSY must fail. If the bounce reclaims the range on strong volume, the breakdown is failing — cover or stand aside rather than adding.
- Ignoring the higher-timeframe context. An SOW against a strong higher-timeframe uptrend is lower-odds. Prefer breakdowns that agree with the bigger picture.
An SOW confirms weakness but is not a guarantee; breakdowns fail and can turn into springs. Prefer entries on the LPSY with a stop above it, keep size sensible, and let price confirm the markdown rather than front-running it.