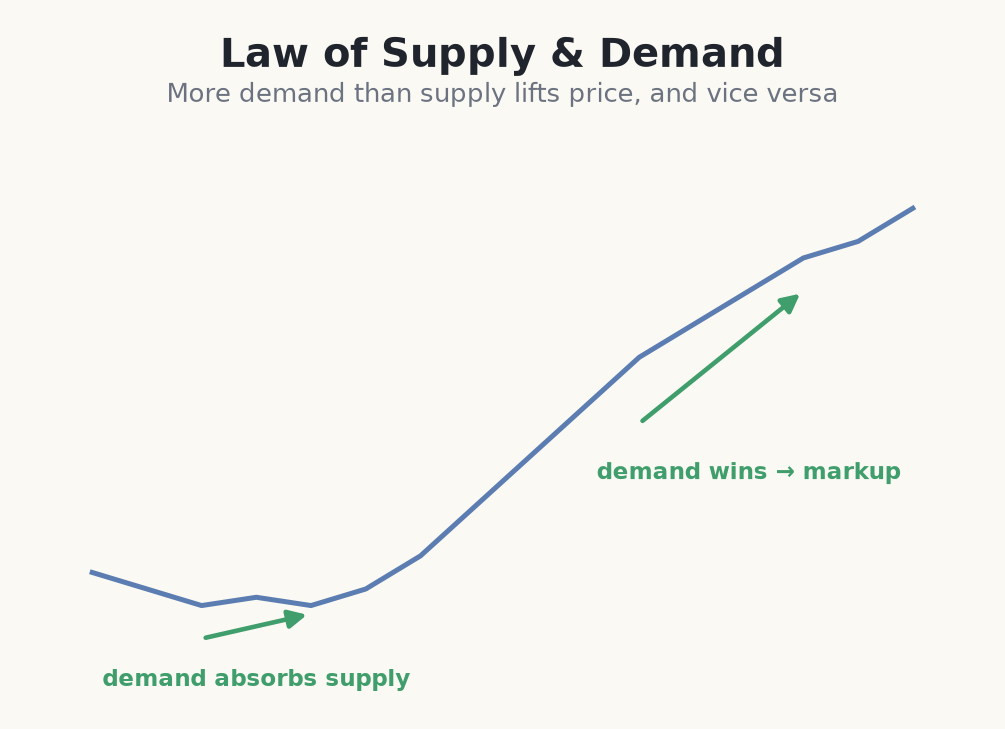
The first law is the foundation: when demand exceeds supply price rises, and when supply exceeds demand it falls. Everything else in Wyckoff is a refinement of how to detect this imbalance before it fully plays out.
Reading the imbalance
You cannot see the order book directly, so you infer the balance from how price responds. Rallies on rising volume that hold their gains suggest demand is in charge; declines that stall and can't make new lows suggest supply is drying up. The tape leaves clues even when you can't see every order.
Pay close attention to what happens at range edges. If price pushes into resistance but is met by heavy selling and falls back, supply is present. If it dips to support and is bought aggressively, demand is present. Repeated tests reveal which side is being exhausted.
- Wide up-candles on strong volume: demand in control.
- Wide down-candles on strong volume: supply in control.
- Failure to extend despite heavy volume: the opposing side is absorbing.
- Narrowing ranges near an edge: one side may be running out.
How to use the imbalance in a trade
Reading the imbalance is only half the job — you act on it at a defined level with a stop. When demand looks dominant at a support edge, you wait for proof (absorption, a failure to make new lows, a strong up-bar) and then buy with your stop just beyond the point that would prove demand had actually failed. The imbalance tells you the likely direction; the level and stop tell you exactly where you are wrong and keep the loss small when the read misses.
Trading a demand-dominant support edge
- 1On the 4-hour chart, EUR/USD has held a support zone at 1.0750 three times. Each dip there comes on lighter volume and the down-bars keep shrinking — demand looks dominant.
- 2The latest dip to 1.0755 prints a wide bullish bar on rising volume that closes near its high — buyers absorbing supply. Effort and result agree to the upside.
- 3You enter long at 1.0770, placing the stop below the zone at 1.0725. Risk = 45 pips — a close there means supply actually won.
- 4Account €1,000, risk 1% = €10. A 45-pip stop sizes to about 0.022 lots so a full stop costs ~€10.
- 5Target the range top near 1.0860, ~90 pips away — roughly 2:1. Plan is fixed before entry: in 1.0770, out at 1.0725 or 1.0860.
- 6No exceptions: a 4-hour close under 1.0725 and the demand read is invalidated — you exit, no averaging down.
Price rises when demand overpowers supply and falls when supply overpowers demand — read who is winning at the range edges.
Common beginner mistakes reading supply and demand
- Confusing high volume with a direction. Heavy volume only tells you effort was spent — you must check whether price actually moved. Big volume with no progress is absorption, often against the obvious direction.
- Buying support on touch alone. A level touching is not proof buyers showed up. Wait for a failure to make new lows or a strong up-bar before assuming demand won.
- Ignoring exhaustion of your own side. Narrowing up-bars into resistance mean demand is thinning even while price rises. The imbalance can flip before the trend does.
- Reading one candle in isolation. A single wide bar proves nothing; the imbalance shows in repeated tests. Let the range reveal which side is being worn down.
- Trading without a level where the read is wrong. 'Demand looks stronger' is not a plan until you know the exact price that would prove it false. That price is your stop.
This law is a probabilistic read, not certainty. Absorption can continue longer than expected, and a side that looks exhausted can find fresh participants. Confirm the imbalance with follow-through before committing.