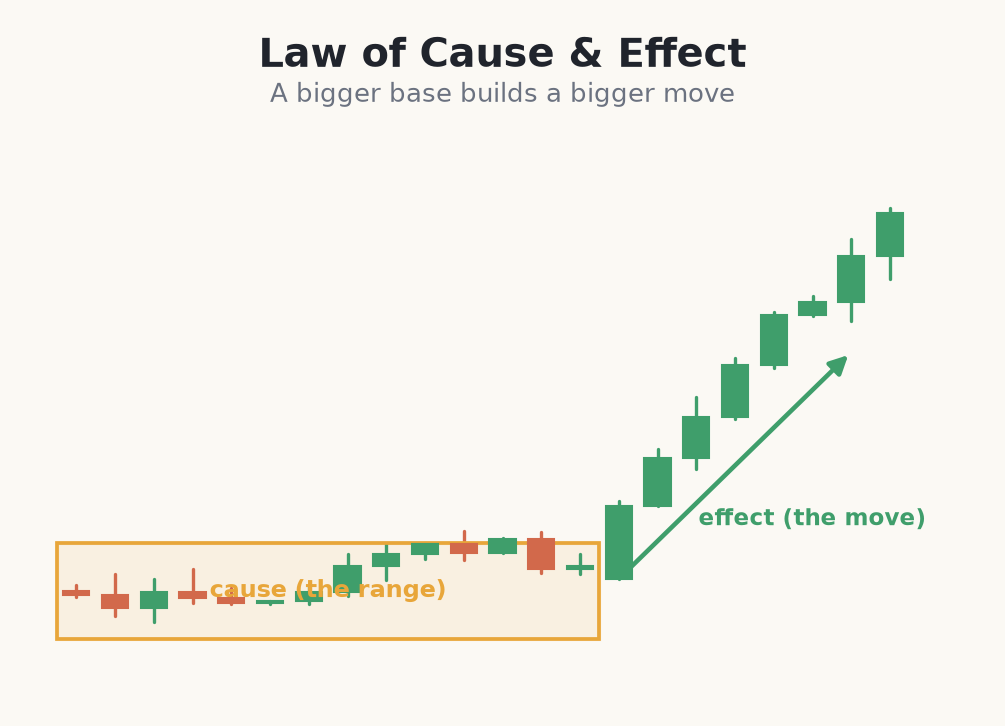
The second law states that a period of preparation is the cause, and the trend that follows is the proportional effect. A large, well-built trading range stores more fuel than a small one and can produce a larger move.
Why the range is the cause
During accumulation the composite operator is absorbing supply; during distribution it is unloading. The longer this takes, the bigger the position being built or exited — and therefore the larger the move needed to realise it. Time and width in the range translate into distance in the trend.
Wyckoff traders traditionally used point-and-figure counts across a range to estimate targets, projecting the horizontal width of the cause into a vertical price objective. Modern traders often use it more loosely — a big base implies a big potential move, a small base a small one.
How to estimate the effect
A practical shortcut on a normal candlestick chart is to measure the height of the range and project it from the breakout point. If a base runs from €50 to €55 — five points tall — a first objective sits near €60 once price breaks up out of it. This is deliberately rough: a wide, choppy range that took many weeks to build stores more cause than a tight, quick one of the same height. Use the projection as a planning aid for where to bank partial profit, never as a price the market owes you.
How to use cause in a trade plan
Cause and effect shapes which trades are worth taking. A setup out of a large base offers room for a healthy reward relative to a stop just beyond the range; a setup out of a tiny base may not clear a sensible reward-to-risk once spread and stop distance are counted. Before committing, compare the projected effect to your stop distance — if the estimated move barely doubles your risk, the trade is marginal and often worth skipping.
Sizing a trade from a measured cause
- 1A stock builds a 7-week base between €50.00 and €55.00 after a long decline — a range height of €5.00 of stored cause.
- 2A wide, high-volume bar breaks up through €55.00. You project the €5.00 height from the breakout to a first objective near €60.00.
- 3You buy the pullback to €55.40, stop just back inside the range at €53.90. Risk = €1.50 per share.
- 4Account €1,000, risk 1% = €10. €1.50 risk per share sizes to 6 shares (≈€332 notional).
- 5The projected effect (~€60.00) is €4.60 of upside against €1.50 of risk — about 3:1, so the trade clears your minimum. You bank part at €60 and trail the rest.
- 6If price closes back under €53.90, the breakout failed and you exit — the cause estimate never overrides the stop.
A trading range is stored cause; the trend that follows is the effect — bigger, longer ranges can fuel bigger moves.
Common beginner mistakes with cause and effect
- Treating a projected target as a promise. Counts and range-height projections are estimates. Price frequently stops short or blows past — manage the trade on the way, don't sit waiting for the number.
- Ignoring range quality. Two ranges of equal height are not equal cause. A long, well-tested base is stronger fuel than a quick, thin one that just happens to be the same size.
- Taking marginal setups out of tiny bases. A small cause rarely justifies the stop distance and spread. If the projected effect barely beats your risk, skip it.
- Forgetting the direction check. Cause tells you how far, not which way. A big base can break down as easily as up — pair it with the supply/demand read.
- Moving the stop to chase the target. Widening a stop so a trade 'has room to reach' the projection turns a small planned loss into a large one. The stop is fixed by the range, not the target.
Treat any count as a rough estimate, never a promise. Targets are frequently overshot or undershot, ranges can extend before resolving, and a projected objective is a planning aid — not a reason to ignore what price is actually doing on the way there.