Volume spread analysis, or VSA, studies the relationship between three things on each bar: its range (the spread from high to low), where it closes within that range, and its volume. The core question is whether effort matches result — whether the volume spent produced a matching move. It is the practical, bar-by-bar application of Wyckoff's effort-versus-result idea.
When a bar has high volume and a wide range in one direction, effort and result agree — the move is genuine. When a bar has high volume but a narrow range, a lot of effort produced little movement, which suggests the other side is quietly absorbing the pressure. That mismatch is the single most valuable thing VSA teaches you to see.
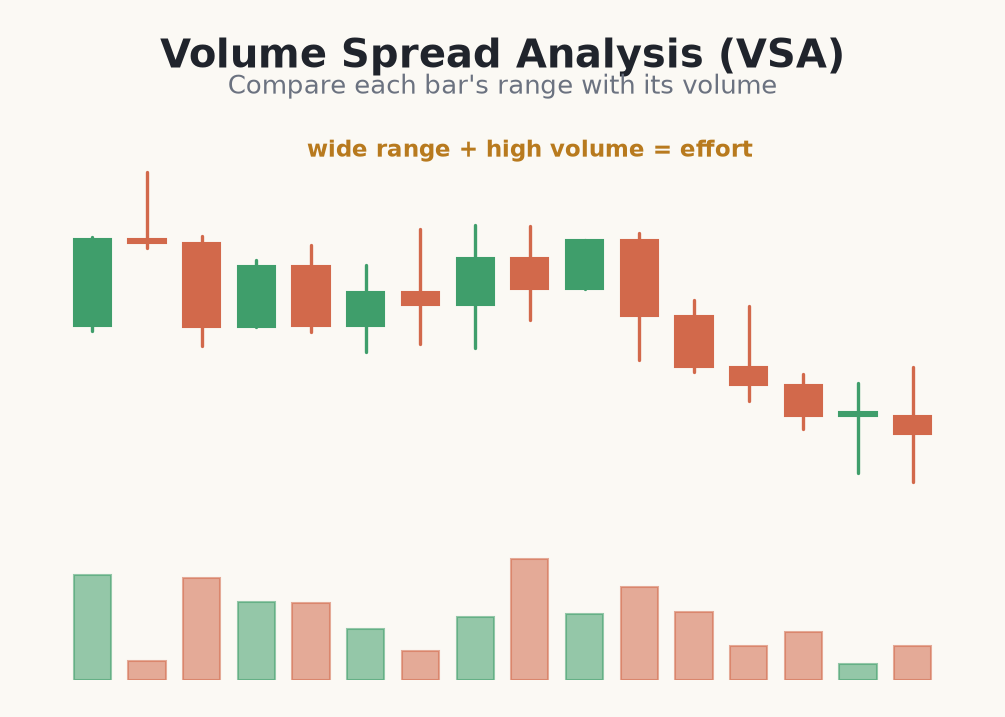
Effort versus result
- <strong>High volume + wide range</strong> = effort and result agree; move is genuine.
- <strong>High volume + narrow range</strong> = heavy effort, little result — possible absorption.
- <strong>Low volume + wide range</strong> = a move on thin participation — treat with caution.
- <strong>Low volume on a pullback</strong> = healthy lack of opposing interest.
- <strong>Where it closes</strong> in the range matters as much as the range itself.
A classic VSA warning is a climax bar: enormous volume with a wide range at the end of a long trend, often followed by a stall. It suggests the last participants have piled in and there is little fresh demand left to push price further — the effort was maximal, but it will turn out to be the exhaustion of the move rather than its continuation.
Reading a high-volume narrow-range bar at support
- 1On the 1-hour FTSE chart, price sells off into a support level at 8,100 after a long decline.
- 2A bar prints at support with huge volume — three times the recent average — but a narrow range and a close near its high. Effort was massive; downward result was tiny.
- 3You read this as absorption: sellers hit the market hard and a large buyer soaked it all up. You wait for a confirming bullish candle, which closes at 8,120.
- 4You enter long at 8,125. Your stop goes below the absorption bar's low at 8,088 — a break there means the buyer failed. Risk = 37 points.
- 5Account £10,000, risking 1% = £100. On FTSE CFD at £1 per point, a 37-point stop sizes to about 2.7 units so a full stop ≈ £100.
- 6You target the prior swing high near 8,210, ~85 points away — about 2.3:1. VSA flagged the absorption; the confirming candle triggered the entry.
Common mistakes with volume spread analysis
- Reading one bar in isolation. A single VSA bar rarely decides anything. It gains meaning only at a key level and in context with the bars around it.
- Ignoring the close. A wide-range bar that closes in the middle tells a different story from one that closes on its extreme. Where it closes is half the signal.
- Treating VSA as a mechanical trigger. It is interpretive. Use it to raise or lower confidence, then wait for a price-action confirmation before acting.
- Trusting VSA on thin CFD data. On tick-volume feeds the spread-to-volume read is noisier. Be more sceptical than a futures trader would be.
- Forgetting the stop. Even a textbook absorption bar can fail. The bar's extreme gives you a natural, defined risk point — use it.
VSA asks whether effort matches result — heavy volume that fails to move price is often the tell that the other side is absorbing it.
VSA is interpretive, not mechanical. It works best read at key levels and in context with structure, and any single bar can mislead. Use it to raise or lower your confidence in a move, then confirm with price before you commit real risk.