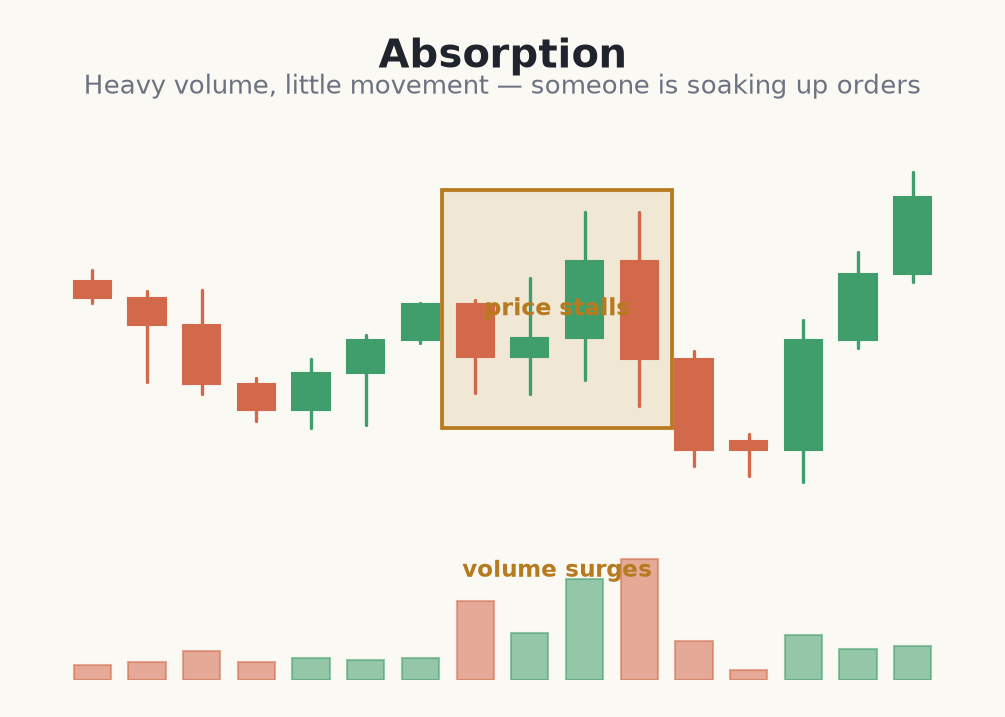
Absorption happens when one side pushes hard — heavy volume, aggressive orders — but price barely moves. The pushing side's orders are being soaked up by large resting orders on the other side, like waves breaking on a sea wall that does not shift. It is one of the clearest examples of effort without result, seen through the lens of order flow.
The mechanism matters. If sellers hit the market with size and price refuses to fall, a large buyer is absorbing that selling, filling their position against the pressure. Once the sellers exhaust themselves, there is little left to stop price rising — which is why absorption often precedes a turn. The absorbing side is quietly building a position while the aggressive side spends itself.
How to spot it
Look for a cluster of high-volume bars at a level where price stops making progress — repeated pushes into support or resistance that fail to break it. On lower timeframes this shows as large volume with tiny candle bodies stacking up at one price, and on order-flow tools as heavy volume printing without the price ticking through.
- <strong>Heavy volume with stalled price</strong> is the signature of absorption.
- <strong>It shows a large passive order</strong> soaking up aggressive flow.
- <strong>It often clusters</strong> at a key support or resistance level.
- <strong>When the aggressive side</strong> exhausts, price can turn sharply.
- <strong>It is a clue, not a trigger</strong> — the absorbing side can still fail.
Trading a reversal after absorption at support
- 1On the 5-minute Nasdaq futures chart, price grinds down into support at 18,000 and three bars in a row print huge volume with tiny bodies — sellers hitting the bid but price refusing to fall.
- 2You read this as a large buyer absorbing the selling. You do not buy yet; you wait for the aggressive sellers to exhaust and price to lift.
- 3A bullish candle finally closes back up at 18,030, breaking away from the absorption cluster. You enter long there.
- 4Your stop goes below the absorption zone at 17,978 — a break there means the buyer failed and support is gone. Risk = 52 points.
- 5Account $12,000, risking 1% = $120. On micro-Nasdaq at $2 per point, 52 points = $104 per contract, so 1 contract keeps risk near budget.
- 6You target the session VWAP overhead near 18,120, ~90 points away — about 1.7:1. The absorption flagged the battle; the breakout candle confirmed who won.
Common mistakes trading absorption
- Buying into the absorption itself. While the battle rages you don't yet know who wins. Wait for price to actually break away from the cluster before entering.
- Assuming the absorber always wins. A large passive order can be overwhelmed. Absorption raises the odds of a turn — it does not guarantee one.
- Ignoring the level. Absorption matters most at a key support or resistance. The same stalled volume in the middle of nowhere means much less.
- Placing the stop inside the zone. The absorption cluster is noisy. Put the stop beyond the whole zone so normal churn doesn't clip you.
- Over-trusting it on CFD tick data. True absorption is clearest with real bid/ask flow. On a tick proxy, read it as a weaker hint and confirm with price.
Absorption is heavy volume meeting a wall of resting orders — when the aggressors run out, the stalled price can reverse hard.
Absorption is a clue, not a signal. It tells you a battle is underway at a level, but the absorbing side can still fail. Wait for price to actually reject the level and confirm before trading the anticipated reversal, with a stop beyond the absorption zone.