On centralised exchanges — stocks, futures — volume is a real count of shares or contracts traded and reported to everyone through the same tape. In CFDs and spot forex there is no central exchange: trades happen bilaterally between you and a broker or across a fragmented network of banks. No single authority sees every trade, so your broker cannot show true market-wide volume. What appears on your panel is almost always tick volume instead, and understanding that difference keeps you honest about what you are actually reading.
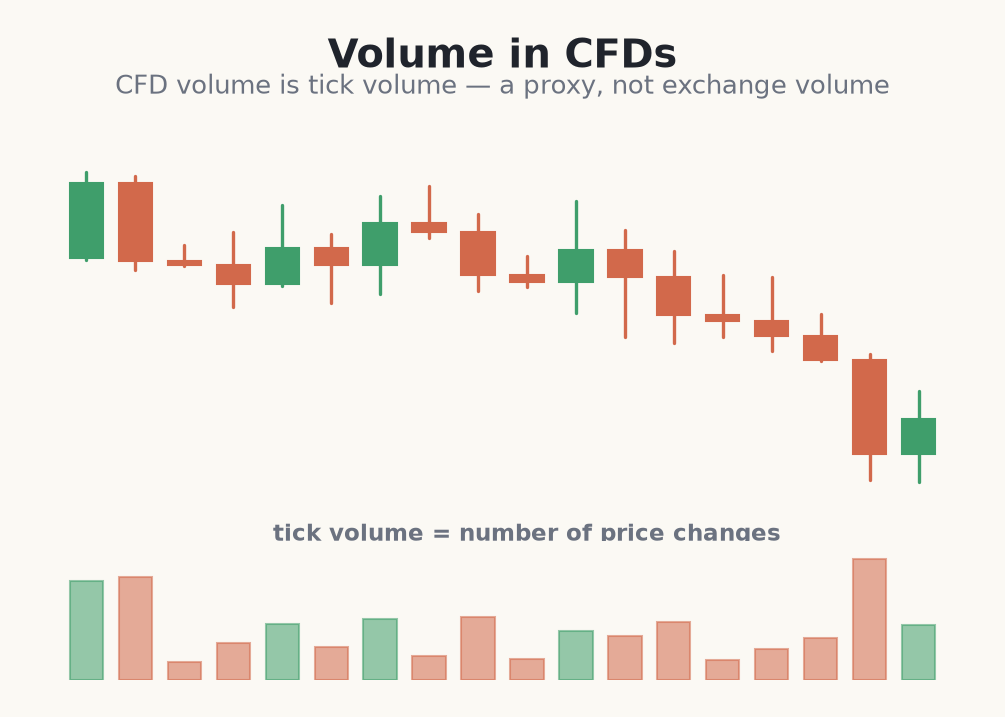
Tick volume is simply a count of price changes — how many times the quoted price updated during a period, not how much money changed hands. If the price ticked 400 times in an hour, the tick volume for that hour is roughly 400, whether each tick moved one lot or one thousand. It is a proxy for activity, never a true traded quantity, and the gap between 'number of updates' and 'size traded' is exactly where the tool can mislead you.
Why the distinction matters
Tick volume tends to correlate with real activity in liquid markets, because busy periods genuinely produce more price changes — studies on major forex pairs during active sessions show a reasonably strong relationship. But it is only a proxy: a market can tick rapidly on tiny orders, a quiet market can move in large clips with few ticks, and two brokers can report different tick counts for the same instrument because they draw from different liquidity feeds.
The practical consequence is that you should read CFD volume as relative and shape-based, never as an exact figure. A tick-volume spike three times the recent average still means 'unusually busy', which is genuinely useful. But comparing your EUR/USD tick count to a friend's on another broker, or treating the number as literal contracts, is reading precision into a tool that does not have it.
- <strong>Tick volume counts</strong> price updates, not contracts or lots traded.
- <strong>It usually rises</strong> and falls with genuine participation in liquid markets.
- <strong>Different brokers</strong> can show different tick volume for the same asset.
- <strong>Read it relatively</strong> — a spike versus recent bars, never as exact size.
- Be <strong>more sceptical</strong> than a futures or stock trader who sees true volume.
Using tick volume honestly on a forex breakout
- 1On the 15-minute GBP/USD chart, tick-volume bars during the quiet Asian session average around 120 ticks per bar.
- 2At the London open, price breaks a level at 1.2650 and the breakout bar prints 410 ticks — over three times the recent average, so you treat the break as backed by real session activity.
- 3You do not read '410' as any traded size — only as 'much busier than the last hour'. You enter long at 1.2655 on the breakout close.
- 4Stop goes back below the level at 1.2632; a return there invalidates the break. Risk = 23 pips.
- 5Account £3,000, risking 1% = £30. On a 23-pip stop that sizes to about 0.13 lots (≈£1.30 per pip) so a full stop costs ~£30.
- 6Target the next resistance near 1.2720, ~65 pips away — about 2.8:1. The tick spike raised your confidence; the stop still defines the risk.
Common mistakes with CFD and forex volume
- Treating tick volume as traded size. It counts updates, not lots. A high tick count on a fast, thin market can overstate genuine participation.
- Comparing volume across brokers. Two feeds produce two different counts for the same pair. Only compare a bar to other bars on the same chart and broker.
- Trusting absolute numbers. There is no 'right' tick volume figure. Everything is relative to the recent bars in front of you.
- Applying stock-market volume rules blindly. Techniques built on true exchange volume need extra scepticism on CFDs, where the data is a proxy.
- Ignoring session context. Tick volume naturally swells at session opens and news. Judge a spike against the same time of day, not a dead overnight bar.
CFD and forex volume is usually tick volume — a count of price changes, not real traded size — so treat it as a useful proxy with real limits.
The honest takeaway: you can still apply every volume concept in this course to CFDs, but read them as relative and approximate. Compare each bar to recent ones, respect that the tool is a proxy, and let that scepticism keep your position sizing conservative when the data itself is uncertain.