Volume is the amount of activity behind a price move — how many contracts, shares or ticks changed hands during a period. Price answers where the market went; volume answers how much conviction stood behind it. The same 30-pip move can mean two completely different things: on heavy volume it means a crowd agreed and pushed together, while on thin volume it can be a handful of orders drifting through an empty book. Volume is the second dimension that turns a price chart from a line into a story about participation.
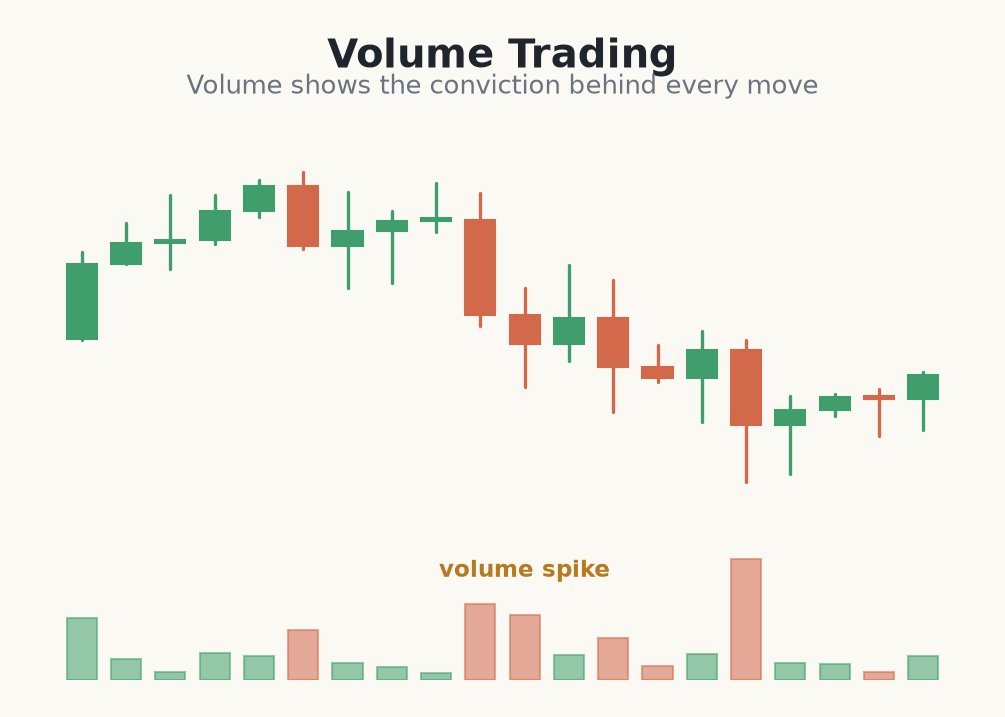
The panel sits beneath the candles, and each volume bar lines up with exactly one candle — it measures the effort spent producing that single period. The habit to build is reading them as a pair: never look at a candle without glancing at the bar under it. Rising price on expanding volume suggests genuine participation and fresh money; rising price on shrinking volume hints the move is coasting on momentum and running low on fuel.
Why volume matters
Every transaction needs a buyer and a seller in equal measure, so volume itself is directionally neutral — it counts activity, never direction. Its whole value is as a measure of interest. A breakout backed by a surge in volume shows many participants agreeing with the new price and committing capital to it; a quiet breakout can be a few resting orders that fade the moment the pressure lifts. This is why volume is treated as confirmation rather than a signal: it tells you whether to trust what price is doing.
The single most useful skill is judging volume relative to recent bars, not against some absolute number. A 50,000-contract bar means nothing on its own — but 50,000 when the last ten bars averaged 20,000 is a spike worth respecting. Train your eye to see each bar as tall, average, or thin compared with its neighbours, because that relative reading is what turns raw volume into information.
- <strong>Volume measures effort</strong> or participation, not direction on its own.
- <strong>Read each bar against</strong> the candle directly above it — never in isolation.
- <strong>Expanding volume confirms</strong> interest; contracting volume warns of fading interest.
- <strong>Judge bars relatively</strong> — tall or thin versus recent bars, not absolute counts.
- Volume is <strong>context for price</strong> — it rarely gives a tradable signal by itself.
Reading conviction into a breakout with volume
- 1On the 1-hour DAX chart, price has ranged between 18,000 and 18,120 for hours, and the volume bars under the range average about 4,000 contracts.
- 2A candle closes above 18,120 and its volume bar prints 11,000 contracts — nearly three times the range average. That surge is your read that the break has real participation behind it, not a lone order.
- 3You enter long at 18,130 on the close of the breakout candle, treating the expanding volume as confirmation rather than the trigger by itself.
- 4Your stop goes back inside the range at 18,085 — a return there means the break failed. Risk = 45 points.
- 5Account is €5,000 and you risk 1% = €50. With DAX at €1 per point per micro-contract and a 45-point stop, you size about 1 micro-contract so a full stop costs ~€45.
- 6You target the prior swing high near 18,260, ~130 points away — roughly 2.9:1 reward-to-risk. Every number is fixed before you click.
Common mistakes reading volume for the first time
- Reading volume as directional. A tall bar does not mean 'buyers' — it means activity. The candle's colour and close tell you who won; the bar only tells you how hard they fought.
- Chasing absolute numbers. 'High volume' means high versus recent bars. Comparing today's raw count to a number in a book or another instrument tells you nothing.
- Ignoring the bar under the candle. A beautiful breakout candle on below-average volume is a warning, not a green light. Always pair the two.
- Trading volume as a standalone signal. Volume confirms or questions a price event — it never generates one on its own. Wait for the price setup first, then check the bar.
- Forgetting the stop because the spike looked convincing. Heavy volume raises the odds; it removes none of the risk. The setup can still fail on the next bar.
Volume is the conviction behind price — it tells you how much the market cared about a move, not which way it will go next.
Throughout this course we build from raw volume to profiles, VWAP and order-flow tools like delta. No single volume tool wins every time, so treat everything here as context, not certainty, and keep risk management central to every decision — the spike that looks obvious in hindsight was just a probability in real time.