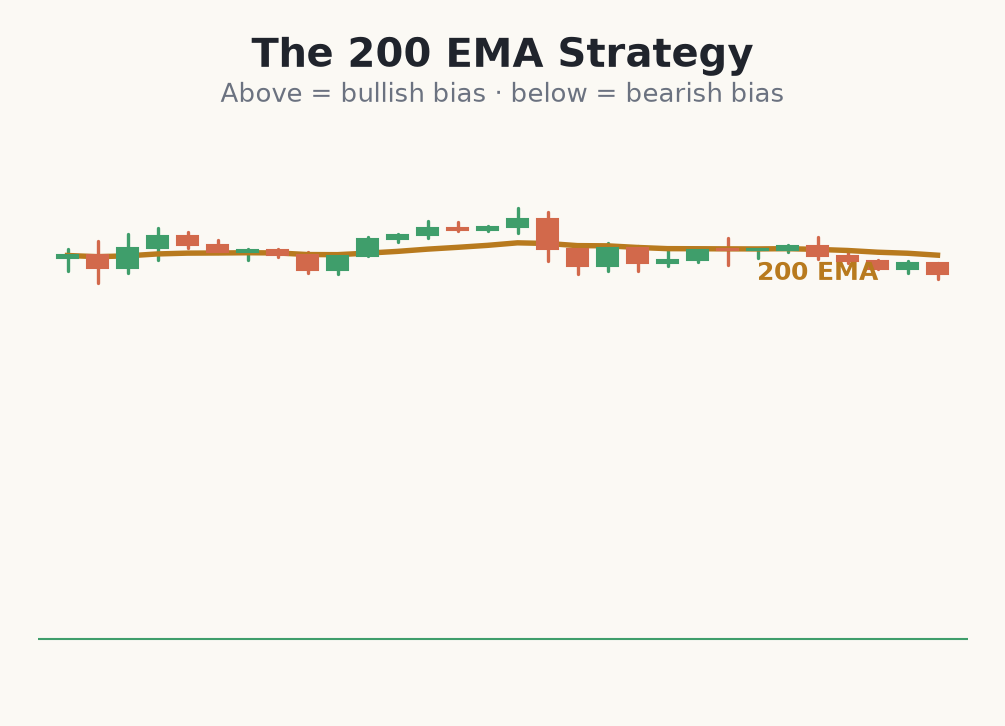
The 200 EMA is one of the most watched lines in trading. Because so many participants observe it, it acts as a widely respected long-term trend filter. The simple rule of thumb: when price is above it, favour longs; when price is below it, favour shorts.
Using it as a bias filter
The 200 EMA works best not as a standalone signal but as a directional filter. If price is comfortably above it and the slope is up, you only look for buy setups from your other tools. This one rule alone stops many beginners from shorting strong uptrends and buying deep downtrends.
Entry and stop logic
A common approach is to wait for price to pull back toward the 200 EMA in an uptrend, look for signs of buyers returning, and enter with a stop placed just below the recent swing low or below the EMA itself. The logic is honest: if price closes firmly back through the line, the premise is wrong and you exit.
- Bias: long only above the rising 200 EMA, short only below the falling one.
- Entry: on a pullback to the EMA that shows the trend resuming.
- Stop: beyond the swing that would break the setup, not an arbitrary distance.
- Filter, don't force — a flat 200 EMA means no edge, so stand aside.
A 200 EMA pullback long, sized properly
- 1On the 4-hour Nasdaq (NAS100) chart, price is trading well above a rising 200 EMA — bias is long only.
- 2After a rally, price drifts back down toward the EMA near 18,200 and stalls, printing a bullish rejection candle off the line.
- 3You enter long at 18,240 as the candle closes, placing the stop just below the EMA and swing low at 18,120 — risk = 120 points.
- 4Account is €5,000, risking 1% = €50; with a 120-point stop and $1 per point per micro-lot, you size to about 0.4 lots.
- 5You target the prior high near 18,600, ~360 points away — roughly 3:1. If price closes back below the EMA, the premise is dead and you are out.
Common beginner mistakes with the 200 EMA
- Trading it as a signal, not a filter. A single touch of the 200 EMA is not a buy or sell — it only sets which direction you are allowed to look.
- Using it in a flat market. When the EMA is horizontal, price crosses it constantly and the filter gives conflicting readings. Stand aside.
- Shorting strong uptrends because 'it's far from the EMA'. Distance from the average is not a reversal signal — strong trends stay stretched for a long time.
- Placing the stop right on the line. Normal noise pokes through the EMA. Put the stop beyond the swing that would truly break the setup.
- Forgetting it lags. The 200 EMA confirms a regime, it never predicts the next turn. Treat late confirmation as a feature, not a flaw.
Use the 200 EMA to set your bias — long above, short below — and let pullbacks to it offer entries with a clearly defined invalidation.
Be honest about its limits. In a sideways market price crosses the 200 EMA repeatedly and the filter gives conflicting readings. It is a tool for trending conditions, and like every average it lags — it confirms direction rather than predicting the next turn.