A moving average smooths price into a single flowing line by averaging the last N closes. It filters out noise so you can see the underlying direction. The two most common types are the simple moving average (SMA) and the exponential moving average (EMA) — and the difference between them is entirely about how much weight they give to recent versus old prices.
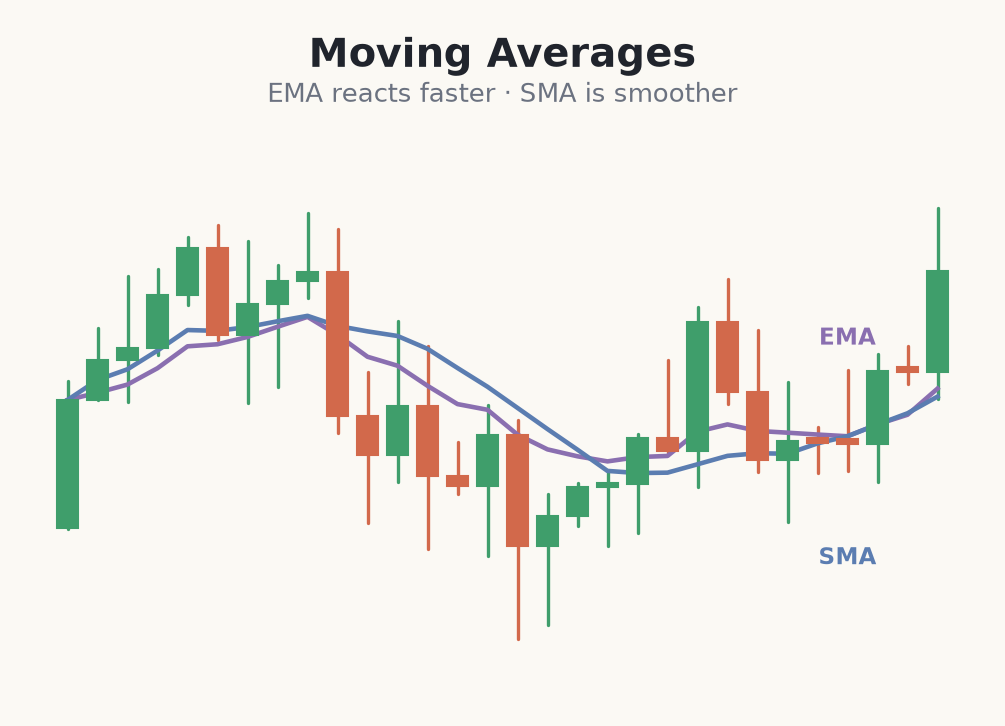
SMA versus EMA
The SMA weights every period equally, so it is smooth but slow to react. The EMA gives more weight to recent prices, so it turns faster and tracks price more closely — at the cost of more false turns. Neither is better in absolute terms; they simply trade responsiveness against smoothness. Faster tools catch moves earlier but cry wolf more often; slower tools are calmer but late.
The length you choose sets the character. A short average (like 9 or 20) reacts quickly and suits shorter-term trading; a long average (like 50 or 200) is slow and defines the bigger trend. Read the slope: a rising average suggests an uptrend, a falling one a downtrend, and a flat one a range. The slope, not the exact number, is what you trade.
- <strong>SMA</strong>: equal weight to all periods — smoother, slower to react.
- <strong>EMA</strong>: more weight to recent prices — faster, more responsive.
- Short lengths track price closely; <strong>long lengths</strong> define the major trend.
- A flat, tangled moving average is a warning that <strong>no trend exists</strong>.
Buying a pullback to a rising 20 EMA
- 1On the 1-hour chart, gold is in an uptrend and the 20 EMA is rising beneath price — your bias is long only.
- 2Price pulls back and taps the EMA near 2040, then prints a strong green close showing buyers defending the average.
- 3You enter long at 2044 and place the stop just below the EMA and the pullback low at 2032 — risk = 12 points.
- 4Account is €3,000, risking 1% = €30; a 12-point stop sizes you to roughly 0.25 lots on gold.
- 5You target the prior swing high near 2080, about 36 points away — a clean 3:1 reward-to-risk before costs.
Common beginner mistakes with moving averages
- Chasing the crossover blindly. A slope or cross in a flat market is noise. Confirm a real trend exists before trusting the line.
- Using one length for everything. A 200 EMA times nothing on a 1-minute scalp; a 9 EMA is useless for the daily trend. Match the length to your timeframe.
- Expecting the average to call turns. Every moving average lags — it confirms trends, it does not predict reversals. Using it to pick tops is a losing game.
- Placing stops on the line itself. Price noise clips a stop sitting exactly on the average. Put the stop beyond the swing the pullback formed.
- Stacking five averages. A screen of tangled lines gives conflicting slopes and paralysis. One or two are plenty.
A moving average smooths price to reveal direction — the EMA reacts faster, the SMA is smoother, and both lag because they average the past.
Remember that every moving average is a lagging tool. It confirms a trend that is already underway rather than predicting a new one, which is exactly why it is useful for staying with a move and dangerous for calling turning points.