Before any indicator, you must know whether a market is trending at all. An uptrend prints higher highs and higher lows; a downtrend prints lower highs and lower lows; a range drifts sideways with no clear progression. Reading this from price first keeps your indicators honest — because almost every trend tool you own will fire misleading signals the moment the market stops trending.
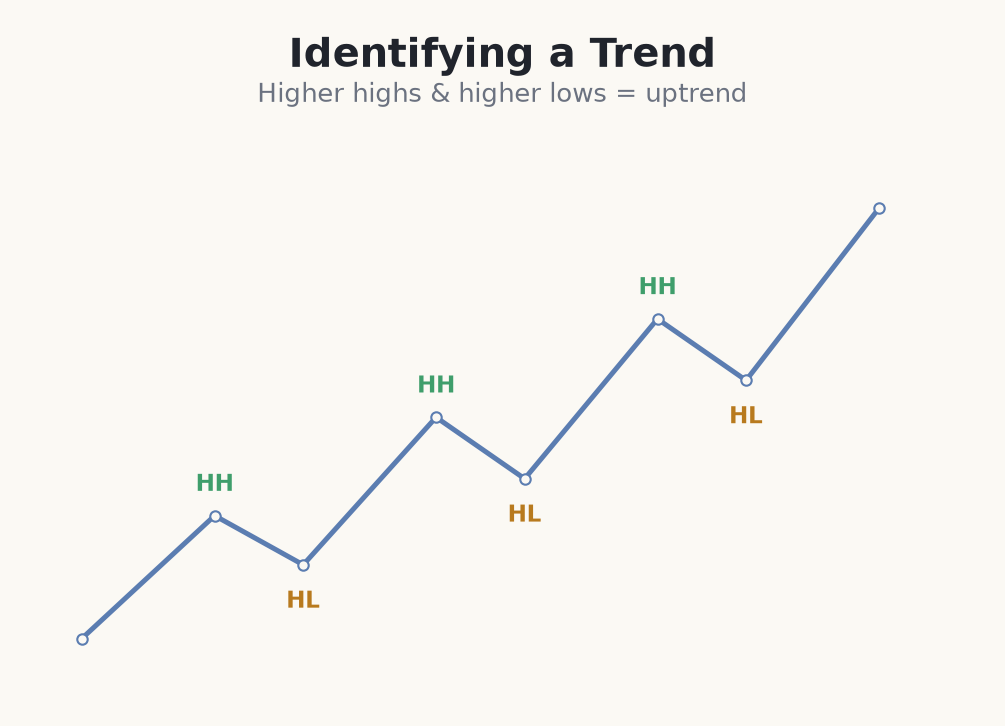
The three market states
- <strong>Uptrend</strong>: successive higher highs and higher lows — buyers in control, favour longs.
- <strong>Downtrend</strong>: successive lower highs and lower lows — sellers in control, favour shorts.
- <strong>Range</strong>: highs and lows stay roughly level — neither side in control, stand aside or fade edges.
The most common mistake is applying trend tools to a ranging market. Moving average crossovers, MACD and Supertrend all whipsaw badly when price chops sideways, firing signal after signal that reverses immediately. Recognising a range early tells you to stand aside or switch tactics — and that single act of restraint saves more money than any clever entry.
Timeframe matters too. A market can be in an uptrend on the daily chart and a downtrend on the hourly. Decide which timeframe you trade, and let the higher timeframe set your directional bias so your indicator signals point the same way as the bigger picture. When the timeframes disagree, the higher one usually wins.
Classifying a chart in four questions
- 1Zoom out to your bias timeframe (say the 4-hour) and mark the obvious swing highs and swing lows a stranger would circle at a glance.
- 2Ask: is each new high above the last high? On GBP/USD you see 1.2650, then 1.2710, then 1.2780 — yes, higher highs.
- 3Ask: is each new low above the last low? You see 1.2580, then 1.2640 — yes, higher lows. Two yeses = confirmed uptrend.
- 4State it out loud: "higher highs and higher lows — this is an uptrend, I only look for buys." If the highs and lows were flat you would say "range — I wait."
- 5Now, and only now, reach for an indicator to time an entry in that direction — never to argue with the structure you just read.
Common beginner mistakes identifying a trend
- Forcing a trend that isn't there. Flat highs and lows are a range, not 'about to break out'. Trading a range as a trend is the fastest way to get chopped up.
- Reading structure on too low a timeframe. A 1-minute chart flips between up and down every few minutes. Anchor bias on a higher timeframe first.
- Ignoring timeframe conflict. A pretty hourly uptrend inside a daily downtrend is a trap. When timeframes disagree, respect the bigger one.
- Marking every wiggle as a swing. Over-marking turns the chart into spaghetti. Only mark the peaks and troughs that are obvious.
- Applying trend indicators in a range. Crossovers and MACD whipsaw sideways markets relentlessly — recognise the range and switch off the trend tools.
Read the trend from price structure first — indicators work in trends and mislead in ranges, so knowing the state comes before any tool.