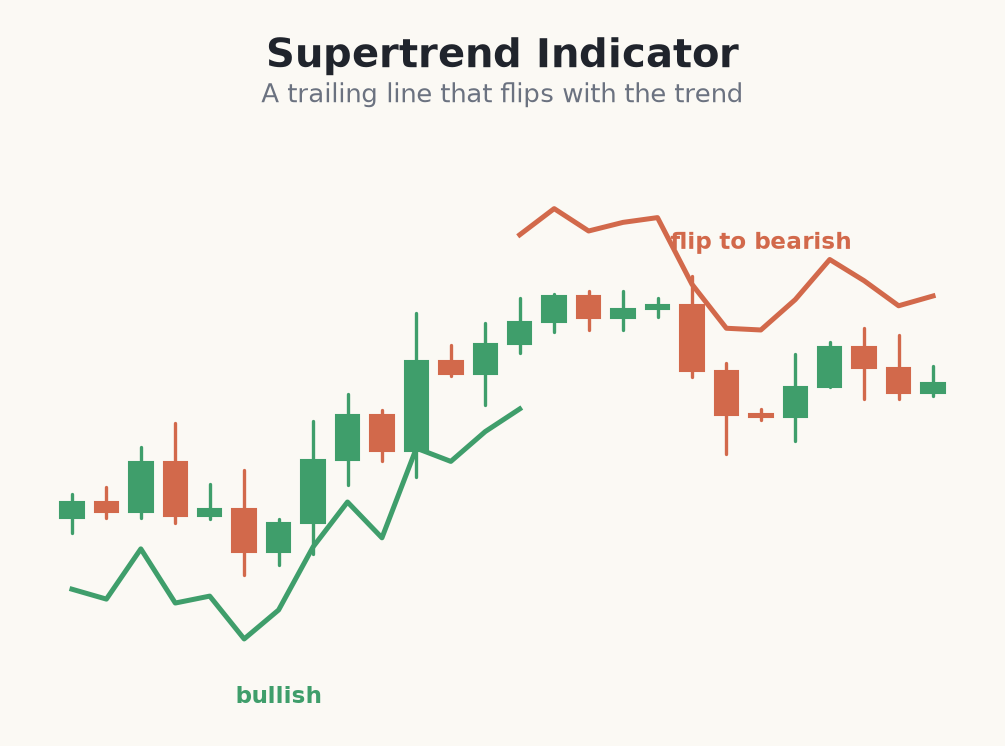
The Supertrend is a trend-following overlay that draws a single line that flips sides of price as the trend changes. It is built from price and the Average True Range (ATR), so it adapts to volatility: the line sits further from price when the market is choppy.
How to read it
When the line is below price and green, the trend is up; when it flips above price and red, the trend is down. Because it uses ATR, it gives price room to breathe in volatile conditions and hugs closer when things calm down, which makes it a convenient trailing stop.
Its honest weakness is the same as every trend tool: in a sideways market the Supertrend flips back and forth constantly, producing a run of small losses. It shines when a market trends cleanly and frustrates when it ranges — so pair it with a check that a trend actually exists.
- Line below price = uptrend; line above price = downtrend.
- Built from ATR, so it adapts to changing volatility.
- Doubles as a trailing stop that follows the trend.
- Whipsaws badly in ranges — best confined to trending markets.
Riding a trend with the Supertrend as a trailing stop
- 1On the 1-hour gold chart, the Supertrend line flips below price and turns green at 2038 — an uptrend signal.
- 2You confirm a real trend exists (higher highs, ADX rising) and enter long at 2042, using the Supertrend line at 2030 as your initial stop — risk = 12 points.
- 3On €3,000 at 1% (€30), that sizes to about 0.25 lots.
- 4As price climbs to 2075, the Supertrend line trails up beneath it to 2060 — you slide the stop up with it, locking in profit.
- 5You stay in until the line finally flips above price near 2078, exiting with most of the move captured. The tool trailed the trend for you.
Common beginner mistakes with the Supertrend
- Trading every flip. In a range the line flips constantly, handing you a run of small losses. Only trust it when a real trend is present.
- Ignoring higher-timeframe context. A flip against the daily trend is often a fake. Filter Supertrend signals with the bigger picture.
- Treating the flip as a reversal trade. It is a trend-following and trailing tool, not a top/bottom picker. Trade with it, not against it.
- Setting the ATR multiplier too tight. Too tight and normal noise flips the line; too loose and it lags badly. Tune it to the instrument.
- Forgetting it lags. Like every trend tool, it confirms rather than predicts. Late flips are the price of avoiding noise.
The Supertrend flips with the trend and works as a volatility-based trailing stop — excellent in clean trends, unreliable in choppy ranges.