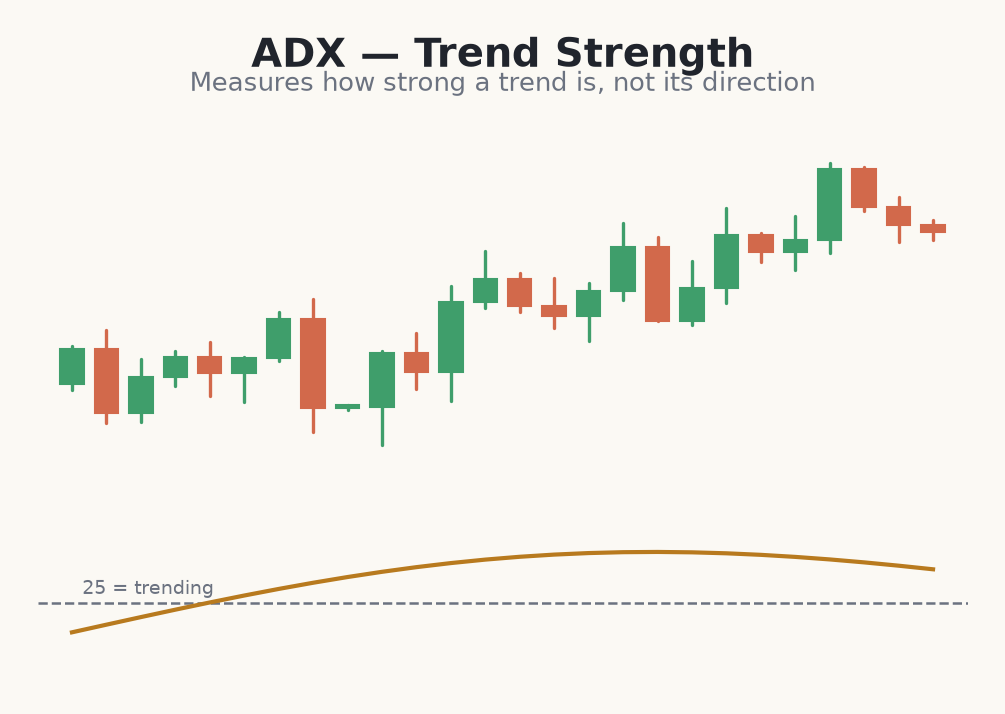
The Average Directional Index (ADX) measures how strong a trend is, not which way it points. It runs from 0 to 100: low readings mean a weak or absent trend, high readings mean a strong one. This makes it the perfect companion to your directional tools.
Reading the levels
A common convention treats readings below 20 as ranging and readings above 25 as trending. A rising ADX says the current trend — up or down — is gaining strength; a falling ADX says it is weakening, regardless of which direction price is going.
Used well, ADX acts as a gatekeeper: it tells you when your crossover, MACD or Supertrend signals are worth taking. When ADX is low, those trend tools whipsaw, so many traders simply stand aside until strength returns rather than fighting a flat market.
- ADX measures strength only — direction comes from other tools.
- Below ~20: weak or ranging; trend strategies struggle.
- Above ~25: trending; trend-following signals are more reliable.
- A rising ADX confirms strength; a falling one warns of a stall.
Using ADX as a gatekeeper before a crossover
- 1On the 1-hour EUR/USD chart, a bullish moving-average crossover fires — but before acting you check the ADX.
- 2The ADX reads 16 and flat, below the ~20 threshold — the market is ranging, so the crossover is likely a whipsaw. You skip the trade.
- 3Two days later another crossover appears; this time ADX is 28 and rising — a genuine trend is present.
- 4Now you take the long at 1.0910 with a stop below the swing at 1.0880 (30 pips), sized to 1% risk.
- 5The ADX didn't give direction — it told you when your directional signal was worth trading, filtering out the low-quality one entirely.
Common beginner mistakes with the ADX
- Reading direction into it. ADX measures strength only. A high ADX in a downtrend is not bullish — direction comes from other tools.
- Trading trend signals at low ADX. Below ~20 the market is ranging and trend tools whipsaw. Stand aside until strength returns.
- Ignoring the slope. A falling ADX warns a trend is stalling even if it's still high. Watch whether it's rising or fading.
- Using it alone. ADX is a filter, not an entry. Pair it with a direction tool and a momentum trigger.
- Expecting exact thresholds. 20 and 25 are conventions, not laws. Treat them as rough zones, not precise switches.
ADX gauges trend strength, not direction — use it as a filter to know when your directional signals are actually worth trading.