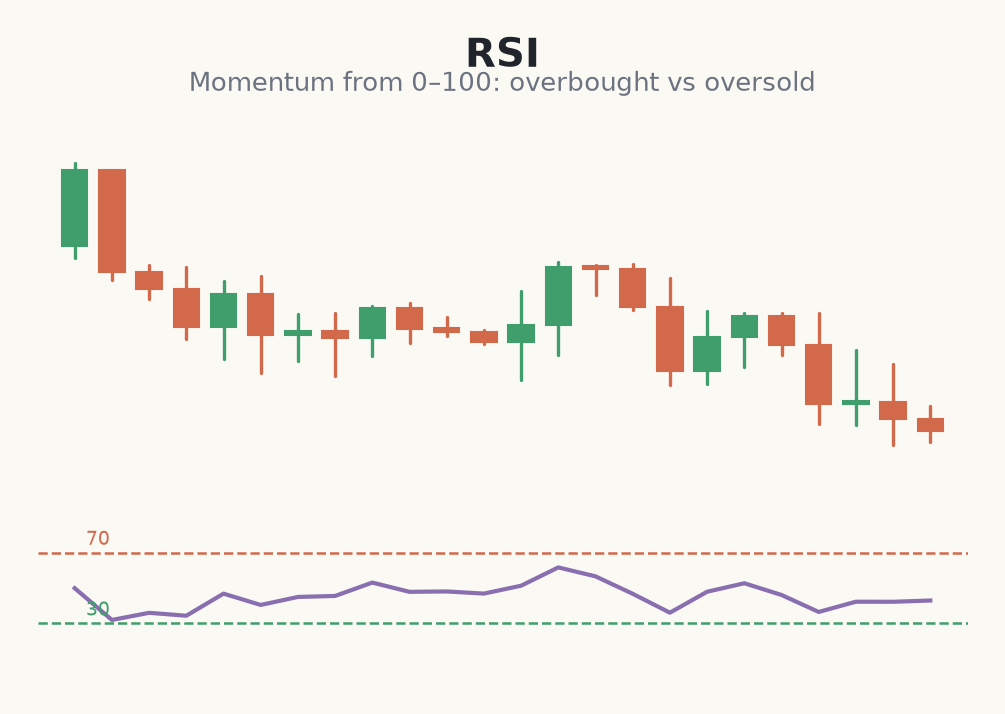
The Relative Strength Index (RSI) is a momentum oscillator that moves between 0 and 100. It compares the size of recent gains to recent losses, giving a reading of how strong or stretched a move is. Readings above 70 are called overbought and below 30 oversold.
The overbought trap
The biggest beginner mistake is shorting simply because RSI is overbought. In a strong uptrend RSI can stay above 70 for a long time while price keeps rising. Overbought does not mean 'sell' — it means momentum is strong. Fighting that with a fixed rule is a fast way to lose.
Using RSI with the trend
A more robust use is to trade RSI in the direction of the trend. In an established uptrend, wait for RSI to dip toward oversold on a pullback and then turn back up as price resumes — that is a lower-risk long entry, with a stop below the pullback low. The oscillator times the entry; the trend gives you the direction.
- RSI above 70 = strong momentum, not an automatic sell.
- RSI below 30 = weak momentum, not an automatic buy.
- In uptrends, buy pullbacks as RSI turns up from lower readings.
- The 50 level often acts as a rough bull/bear midline.
A trend-aligned RSI pullback buy
- 1On the 1-hour gold chart, price is in a clear uptrend making higher highs — bias is long only.
- 2Price pulls back and RSI dips to 38, near oversold for this trend, while price stalls at prior support of 2035.
- 3RSI turns back up through 45 as a green candle closes at 2042 — momentum resuming with the trend. You enter long there.
- 4Stop goes below the pullback low at 2028 — risk = 14 points. On a €3,000 account at 1% (€30) that sizes to about 0.2 lots.
- 5You target the prior high near 2080, ~38 points away — nearly 3:1. RSI timed the entry; the trend gave the direction.
Common beginner mistakes with RSI
- Shorting just because it's overbought. In a strong uptrend RSI can hold above 70 for a long time. Overbought means strong, not 'sell'.
- Buying just because it's oversold. In a downtrend RSI can sit below 30 for ages. Oversold means weak, not 'buy'.
- Ignoring the trend entirely. RSI is a timing aid, not a direction caller. Trade it with the higher-timeframe trend, not against it.
- Acting on a single reading. Wait for RSI to actually turn and for price to confirm; a number alone is not an entry.
- Forgetting it's derived from price. RSI lags and can be flat while price does something else — always confirm on the chart itself.
RSI measures momentum, not destiny — overbought can stay overbought, so use it with the trend rather than against it.
Like all indicators, RSI is derived from price and works best as a filter or timing aid, not a standalone signal. Its most powerful use — divergence — gets its own module next.