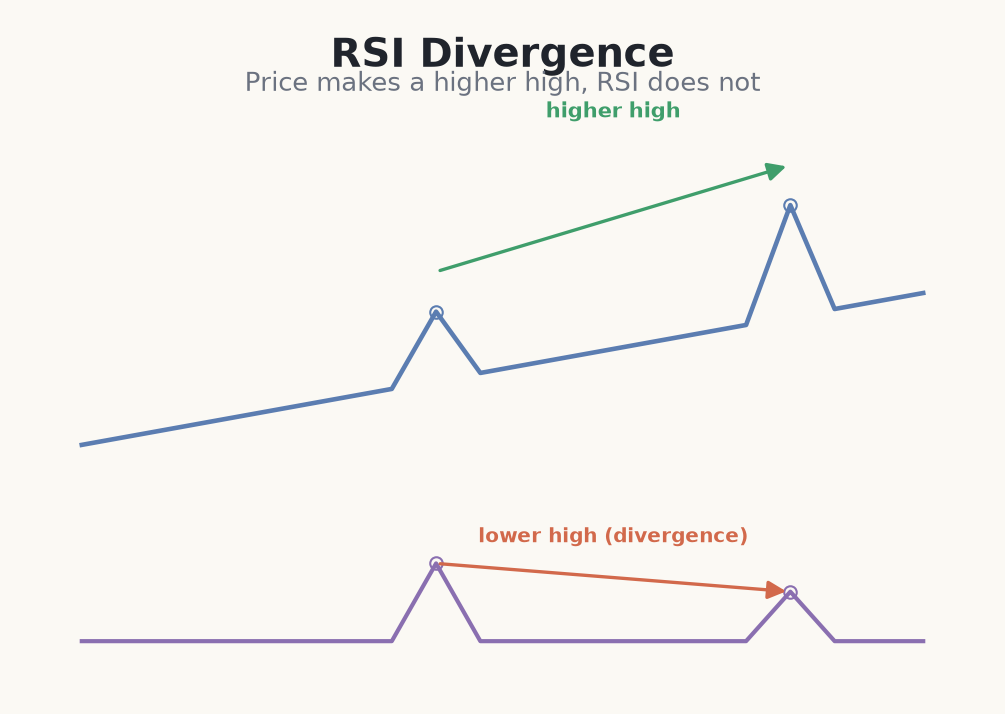
Divergence occurs when price and the RSI disagree. In bearish divergence, price makes a higher high but RSI makes a lower high — the new price extreme came with weaker momentum. In bullish divergence, price makes a lower low while RSI makes a higher low.
Why it matters
Divergence hints that the momentum behind a move is fading even as price still pushes to a new extreme. It often precedes a pause or a pullback, and occasionally a reversal. It is one of the more genuinely forward-looking things an oscillator can show you.
Why it is only a warning
The crucial caveat: divergence can persist for a long time before price responds — a market can print several divergences and keep trending. Treat it as a reason to tighten your stops or take partial profit, not as a standalone entry to trade against a strong trend. Wait for price itself to confirm with a structure break.
- Bearish: higher high in price, lower high in RSI.
- Bullish: lower low in price, higher low in RSI.
- Signals weakening momentum, not a guaranteed reversal.
- Confirm with price action before acting; divergence can repeat.
Trading a confirmed bearish divergence
- 1On the 4-hour Nasdaq chart, price pushes to a new high of 18,500 but RSI prints 68 — lower than the 76 at the previous high. That is bearish divergence.
- 2You do not short immediately — divergence alone is only a warning. You mark it and watch for price to confirm.
- 3Price then breaks the last minor swing low at 18,380, confirming momentum has actually turned. Now you have a signal.
- 4You short the retest of that broken level at 18,400, stop above the divergent high at 18,520 — risk = 120 points.
- 5On a €5,000 account at 1% (€50) you size to about 0.4 lots and target 18,160, ~240 points — a clean 2:1. Divergence warned; the structure break triggered.
Common beginner mistakes with divergence
- Shorting on divergence alone. It can persist for a long time while price keeps trending. Wait for price to confirm with a structure break.
- Fighting a strong trend with it. Divergence against a powerful move is often just a pause, not a top. Respect the trend until it actually breaks.
- Seeing divergence everywhere. Force it and you'll find it on every chart. Only mark clean, obvious higher-high / lower-high (or the bullish mirror) pairs.
- Ignoring the timeframe. Divergence on a 1-minute chart is noise. It carries more weight on higher timeframes.
- Skipping the stop. Even confirmed divergence fails. Trade it with a defined invalidation like any other setup.
Divergence warns that momentum is fading behind a move — a cue to manage risk, not a licence to fight a trend blindly.