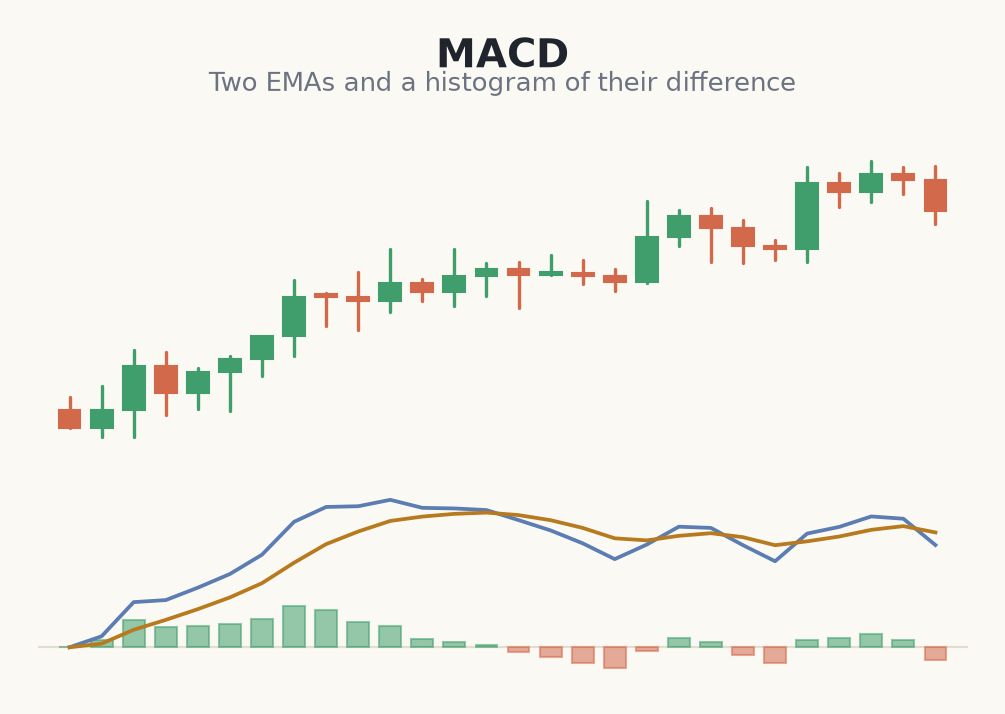
The MACD (Moving Average Convergence Divergence) blends trend and momentum in one indicator. The MACD line is the difference between a fast and a slow EMA; a signal line is an EMA of the MACD line; and a histogram plots the gap between the two.
Reading the components
When the MACD line crosses above its signal line, momentum is turning up; a cross below turns it down. Whether the whole indicator sits above or below the zero line tells you the broader bias — above zero the fast EMA leads, meaning a bullish backdrop.
Entry logic and its limits
A common plan takes a long when the MACD crosses up above the zero line in an uptrend, with a stop below the recent swing low. Requiring the cross to happen above zero filters out many weak signals. Still, because MACD is built from EMAs, it lags price and whipsaws in ranges just like a raw crossover.
- MACD line crossing above signal line = bullish momentum shift.
- MACD above zero = bullish bias; below zero = bearish bias.
- Crosses above zero in an uptrend are higher-quality longs.
- In sideways markets MACD crosses repeatedly and misleads.
A MACD-cross-above-zero long
- 1On the 1-hour EUR/USD chart, structure is bullish and price sits above the 200 EMA — bias is long only.
- 2After a pullback, the MACD line crosses above its signal line and the whole reading is climbing back above zero at 1.0920.
- 3You enter long on that candle close and place the stop below the pullback swing low at 1.0890 — risk = 30 pips.
- 4On a €2,000 account at 1% (€20), a 30-pip stop sizes you to about 0.06 lots.
- 5You target 1.1010, ~90 pips away — a 3:1 trade. Requiring the cross above zero filtered out the weaker mid-range signals.
Common beginner mistakes with MACD
- Taking every crossover. Below zero and in ranges, MACD crosses constantly and mostly fails. Favour crosses that agree with the trend and the zero line.
- Ignoring the zero line. A cross above zero is a very different signal from one deep in negative territory. Read the location, not just the cross.
- Expecting it to lead. MACD is built from EMAs, so it lags. It confirms a move underway, it does not predict the turn.
- Using it in a flat market. Sideways price makes MACD whip back and forth. Check a trend exists first.
- Trading with no stop. The lag means a bad cross can run. Define the invalidation swing before entering.
MACD packages trend and momentum into one tool — crossovers plus the zero line guide bias, but it lags and needs a trending market to work.
The MACD histogram carries extra information about the strength of momentum, which is the focus of the next module.