The MACD histogram measures the distance between the MACD line and its signal line. Its real value is showing the rate of change of momentum. Growing bars mean the move is accelerating; shrinking bars mean it is losing steam even if price still rises.
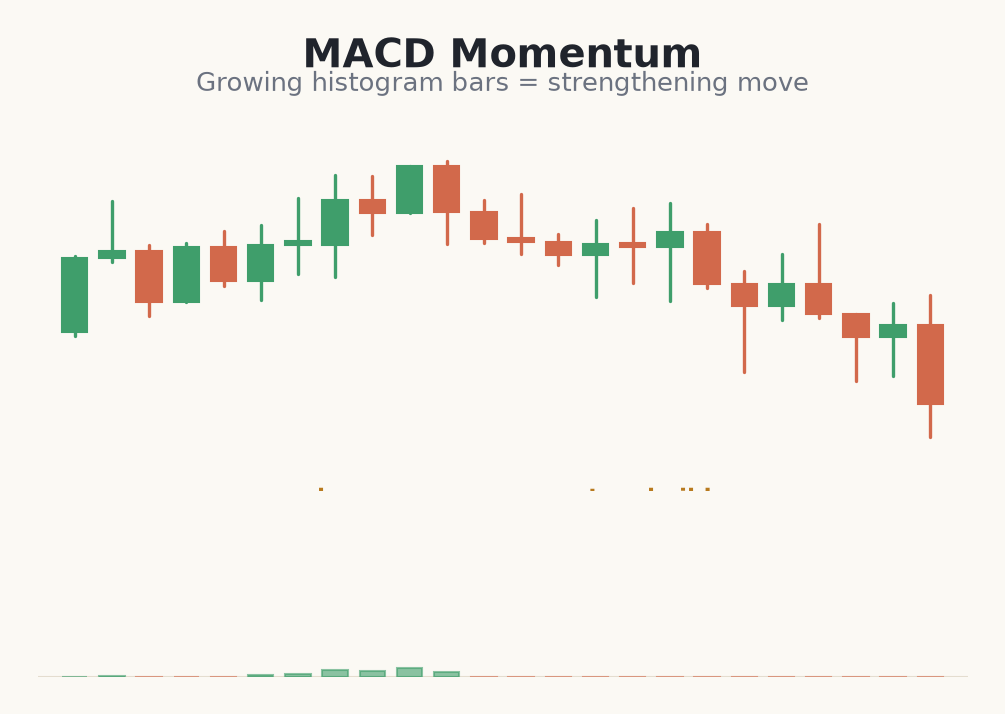
Rising versus fading bars
When bars are expanding away from zero, the two MACD lines are separating and momentum is strong — often a healthy sign for a continuing trend. When bars start contracting toward zero, the lines are converging and momentum is fading, hinting a pullback or crossover may be near.
You can also spot histogram divergence: price makes a new high but the peak histogram bars are smaller than before, showing the push had less force. As with RSI divergence, this is an early warning about momentum, not a reversal signal in itself.
- Bars growing = momentum accelerating with the trend.
- Bars shrinking = momentum fading; a cross or pullback may follow.
- Shorter bars at a new price high hint at weakening drive.
- Momentum reading, not a standalone buy or sell trigger.
Using the histogram to time a scale-out
- 1You are long gold from 2044 in a strong uptrend, and the MACD histogram bars have been expanding — momentum with you.
- 2As price reaches 2072, you notice the histogram bars start shrinking even though price is still ticking up — momentum is fading.
- 3You take partial profit on half the position at 2072, banking the move while it is strong rather than waiting for a reversal.
- 4You trail the stop on the remainder up to breakeven+ at 2050, so the rest is a risk-free runner.
- 5The histogram didn't tell you to reverse — it told you the drive was weakening, which is exactly when a disciplined trader protects gains.
Common beginner mistakes with the histogram
- Shorting on shrinking bars. Fading momentum is a management cue, not a reversal signal. Price can drift higher on weak momentum for a while.
- Reading it in isolation. The histogram is derived from the MACD, which is derived from price. Always confirm on the chart itself.
- Over-reacting to one small bar. A single dip in bar size is noise. Look for a clear, sustained pattern of expansion or contraction.
- Ignoring histogram divergence context. Smaller bars at a new high is a warning, not a top. Wait for price to confirm.
- Forgetting the trend. Momentum bars only matter within the direction structure gives you — don't use them to fight a strong trend.
The histogram reads momentum's rate of change — growing bars back a trend, shrinking bars warn it is running out of fuel.