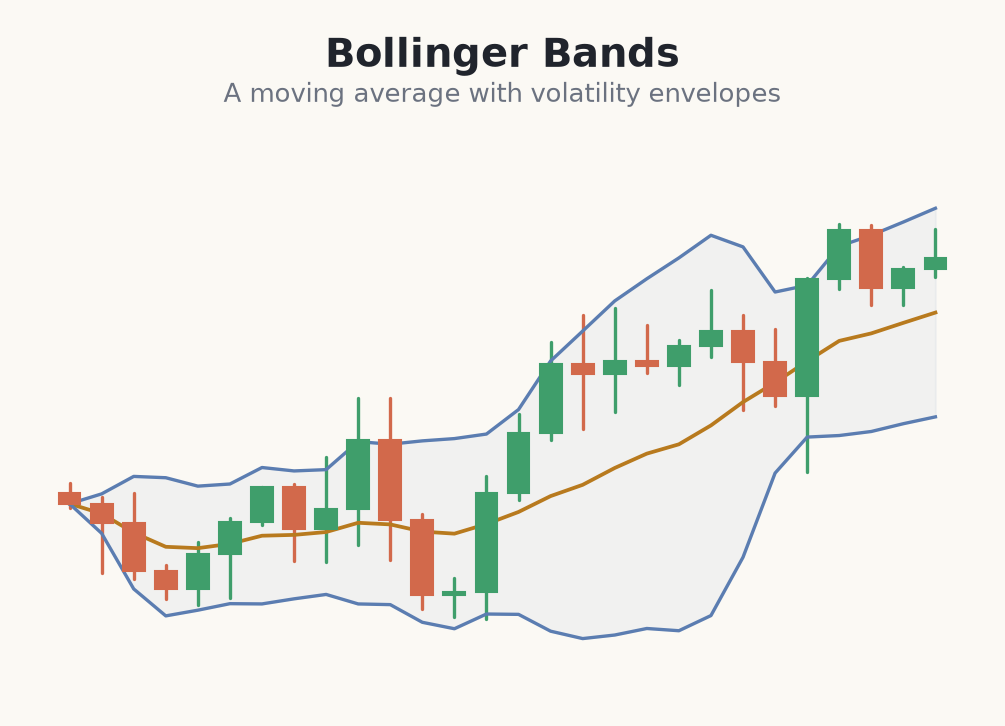
Bollinger Bands wrap price in a volatility envelope. A middle line is a moving average — usually a 20-period — and an upper and lower band sit a set number of standard deviations away. When volatility rises the bands widen; when it falls they narrow.
What the bands describe
Because the bands are based on standard deviation, price spends most of its time inside the envelope. Reaching the upper band simply means price is high relative to recent action; reaching the lower band means it is low. It describes relative position, not a signal by itself.
The band-touch trap
Beginners often sell every touch of the upper band and buy every touch of the lower one. This fails in trends: in a strong uptrend price can 'walk the band', riding the upper edge for a long stretch. Band touches are only worth fading in a clearly ranging market, and even then only with confirmation.
- Middle band: a moving average of recent price.
- Outer bands: standard deviations away — they measure volatility.
- Widening bands = rising volatility; narrowing = falling volatility.
- In trends price can ride a band; touches are not reversal signals.
Fading a band touch — only in a confirmed range
- 1On the 15-minute EUR/USD chart, structure is clearly sideways — flat highs and lows — so mean-reversion is on the table.
- 2Price stretches up to tap the upper band at 1.0960 and prints a bearish rejection candle at the range ceiling.
- 3You short at 1.0955 with a stop just above the band and range high at 1.0975 — risk = 20 pips.
- 4On a €2,000 account at 1% (€20), a 20-pip stop sizes you to about 0.10 lots.
- 5You target the middle band near 1.0920, ~35 pips — roughly 1.7:1. Crucially, you'd skip this entirely in a trend, where price would just walk the band.
Common beginner mistakes with Bollinger Bands
- Fading every band touch. In a trend price walks the band for a long stretch. Only fade touches in a confirmed range, with confirmation.
- Treating a touch as a signal. Reaching a band only means price is relatively high or low, not that it must reverse. It is context, not a trigger.
- Ignoring the band width. Narrow bands and wide bands mean very different things. Read whether volatility is rising or falling first.
- Shorting a strong breakout. Price closing outside the band in a trend is strength, not exhaustion. Don't fade genuine breakouts.
- Forgetting the stop. Even a clean range fades fail when the range breaks. Always place the stop beyond the band and the range edge.
Bollinger Bands map volatility and relative price position — a band touch is context, not a reversal signal, especially in a trend.
The most useful setup from these bands comes when they contract sharply — the Bollinger squeeze — which the next module covers.