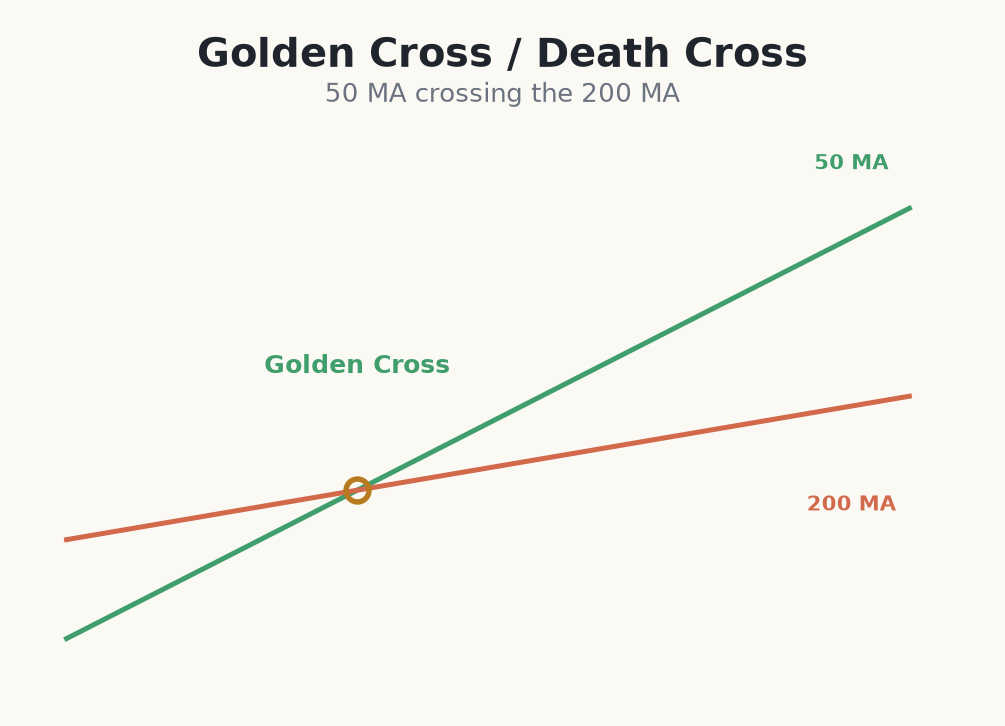
The golden cross and death cross are the most talked-about crossovers in markets. A golden cross occurs when the 50-period average crosses above the 200-period average; a death cross is when the 50 crosses below the 200. They are read as major shifts in the long-term trend.
What they really tell you
Because both averages are long, these crosses are very slow signals. By the time a golden cross prints, a substantial move has usually already happened. They are better understood as a confirmation of a regime change — from bearish to bullish or back — than as a precise timing tool.
Their fame is partly self-fulfilling: media coverage draws attention and can attract buyers around a golden cross. But that attention also means the signal is heavily lagging and prone to false alarms when a market is merely ranging and the two long averages weave in and out of each other.
- Golden cross: 50 MA crosses above 200 MA — long-term bullish shift.
- Death cross: 50 MA crosses below 200 MA — long-term bearish shift.
- Both are slow and confirm a trend already well underway.
- In sideways markets they flip repeatedly and give little edge.
Using a golden cross as context, not a timing tool
- 1On the daily S&P 500 chart, the market has rallied for weeks and the 50-day crosses above the 200-day — a golden cross prints.
- 2You note that price is already far above both averages, so buying the cross itself means a huge stop back at the 200-day.
- 3Instead you use it only as a regime confirmation — bias is now long — and wait for a pullback to time an actual entry.
- 4Price dips to the 50-day near 5,200 and holds; you enter there with a stop below at 5,120 — an 80-point risk, far tighter than chasing the cross.
- 5The golden cross set the direction; a disciplined pullback entry gave you a real, sized trade with sensible reward-to-risk.
Common beginner mistakes with the golden/death cross
- Buying the cross itself. By the time it prints, a big move has already happened. Chasing it means a distant stop and poor reward-to-risk.
- Treating it as precise timing. These are slow regime signals, not entry triggers. Use them for bias, then time entries elsewhere.
- Trusting it in a range. When the market is sideways, the two long averages weave in and out, firing false crosses repeatedly.
- Ignoring the higher context. A death cross during a long-term bull market is often a shakeout, not a top. Read the bigger picture.
- Reacting to the headlines. Media hype around a golden cross is not an edge — the signal is already public and heavily lagging.
The golden and death crosses mark slow, long-term regime changes — useful as context, but far too lagging to time precise entries.