The 1-minute chart is the fastest common scalping timeframe. Each candle represents just sixty seconds, so setups appear and vanish quickly. The appeal is the tight stop: because swings are small, your risk per trade in price terms can be very small, letting you size the position precisely.
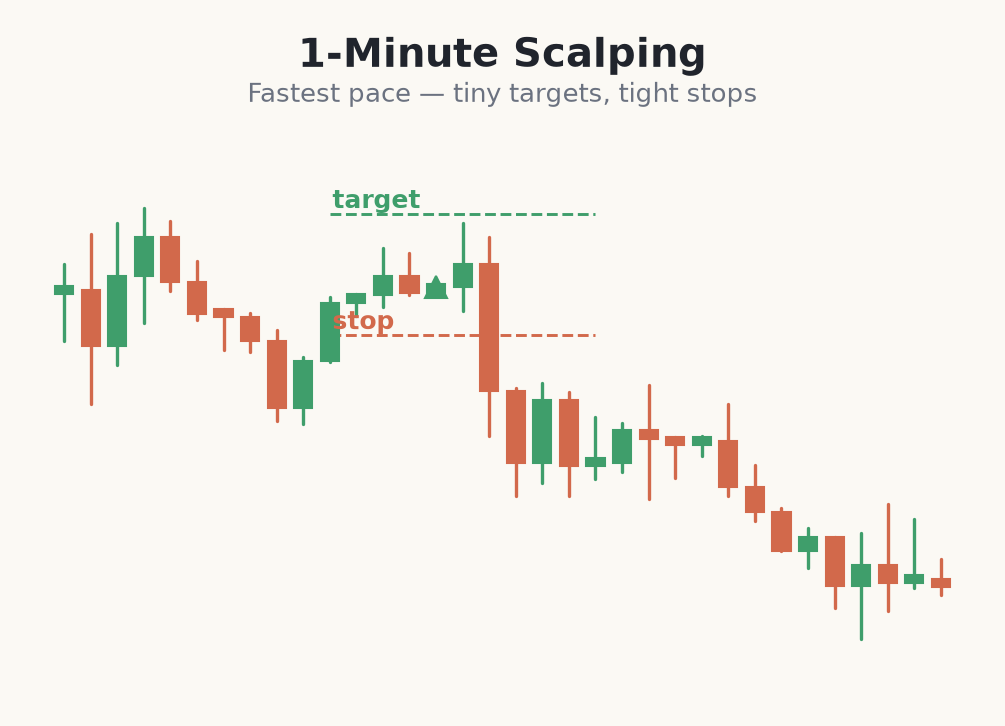
Entry, stop and target
A simple 1-minute scalp aligned with the higher-timeframe trend might wait for a small pullback to a level, enter as buyers return, and place the stop just beyond the swing that formed the entry. The target is modest — often the next minor level or a fixed multiple of the risk. The whole trade can be over in minutes.
The catch is cost. On a 1-minute scalp your target might be only a few pips, so the spread and commission take a large share of every winner and add to every loser. This is why 1-minute scalping is realistic only on the tightest instruments and why so many people quietly lose money doing it.
- Entry: a pullback or micro-break in line with the higher-timeframe bias.
- Stop: just beyond the swing that defines the setup — never widened later.
- Target: a nearby level or a fixed reward-to-risk multiple.
- Reality: costs are proportionally large, so be selective.
A 1-minute scalp on a €1,000 account
- 1Bias from the 15-minute chart is up. On the 1-minute EUR/USD chart price pulls back to a micro-level at 1.09000 and prints a bullish rejection candle.
- 2You enter long at 1.09010, stop just below the 1-minute swing at 1.08980 — a tight 3-pip risk. A close below there and the setup is dead.
- 3Risk 1% = €10 on a 3-pip stop means ~0.33 lots (about €3.30 per pip). Position is small in money but large in lots because the stop is so tight.
- 4Target the next micro-resistance at 1.09070, ~6 pips away — a 2:1 on paper: €20 win versus €10 risk.
- 5Now the cost check: a 0.8-pip spread at 0.33 lots costs ~€2.60 plus commission. On a 6-pip target that tax is roughly a third of your gross reward — the trade only makes sense because the setup is genuinely clean.
- 6You take it or you skip it in seconds; there is no time to negotiate. The tiny target means one sloppy fill or one widened stop wipes out several good scalps.
Common mistakes on the 1-minute chart
- Taking every wiggle. The 1-minute prints dozens of tempting moves an hour; most are noise. Trading them all turns a small edge into a stream of costs.
- Widening the 3-pip stop 'to give it room'. On a tight scalp this instantly doubles your planned loss. The stop is a promise — it never moves against you.
- Chasing an extended move. Entering after price has already run means a worse fill, a wider stop and a target that is now too close. Wait for the pullback or skip it.
- Forgetting the spread is a big fraction of the target. A 6-pip target with a 1-pip spread starts 17% underwater. If costs are not comfortably clearable, there is no trade.
- Trading through news on the 1-minute. A single spike can blow past a 3-pip stop with slippage. Stand aside around scheduled releases.
The 1-minute chart gives tight stops but tiny targets — the smaller your target, the more spread and commission decide your result.
Because the pace is so fast, the 1-minute chart magnifies the danger of overtrading. Taking every wiggle turns a small edge into a stream of costs. Fewer, higher-quality 1-minute trades will almost always beat a frantic click-fest.