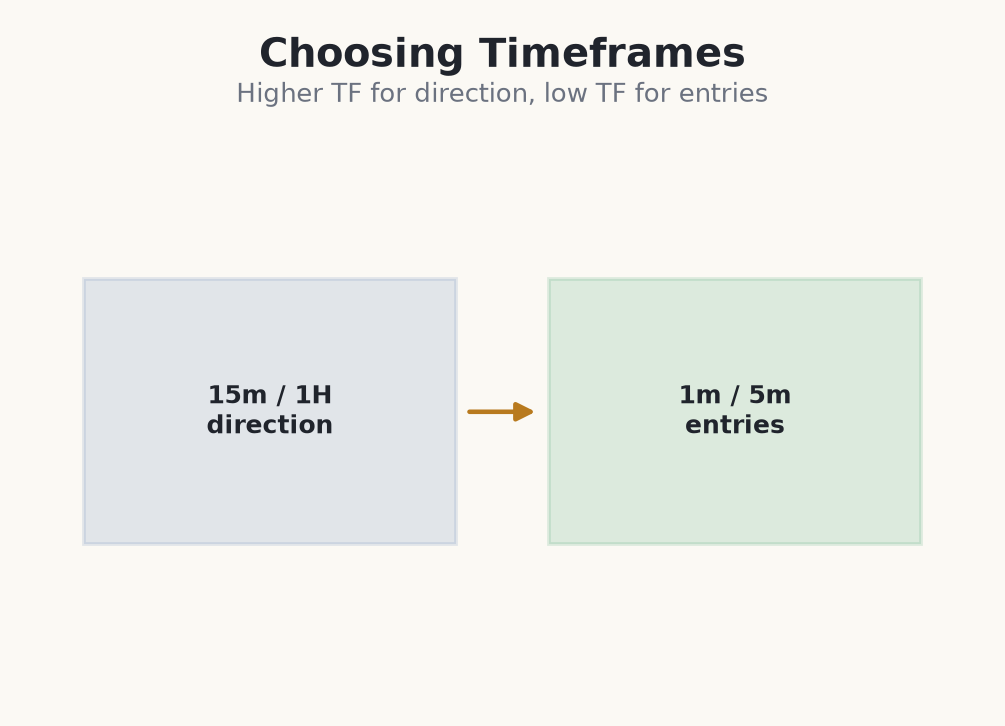
No scalper should trade a single chart in isolation. The professional approach is multi-timeframe analysis: use a higher timeframe to decide the direction and the key levels, then drop down to a lower timeframe to time the entry. The higher chart is your map; the lower chart is your entry trigger.
The higher timeframe: direction
Start on something like the 1-hour or 15-minute chart to establish bias and levels. Is structure trending up, down, or ranging? Where are the obvious highs, lows and round numbers? This step keeps you from taking a perfect-looking 1-minute buy straight into a wall of higher-timeframe resistance.
The lower timeframe: entries
Once you know the direction, drop to the 1-minute or 5-minute chart to time the trade. The lower timeframe lets you enter with a tight stop, but it is also far noisier — plenty of moves there are meaningless wiggles. Only act on the lower chart when it agrees with the higher one.
- Higher timeframe (1H / 15M): trend, bias and key levels.
- Lower timeframe (5M / 1M): precise entries and tight stops.
- Trade the lower chart only in the direction the higher one supports.
- More screens do not mean more trades — most of the time you wait.
A two-chart scalp on a €1,000 account
- 1On the 15-minute EUR/USD chart you read the higher-timeframe state: rising swings, price holding above the last swing low at 1.08300. Bias is up — you only hunt longs.
- 2You mark one key level: the intraday support the higher chart keeps bouncing from at 1.08400. That is where your lower-timeframe trigger must appear.
- 3You drop to the 1-minute chart. Price dips to 1.08400 and prints a strong bullish close — buyers returning in line with the higher bias. You enter long at 1.08420.
- 4Your stop sits just below the 1-minute swing at 1.08380 — a 4-pip risk. Below there the setup is wrong and the higher-timeframe support has failed.
- 5Risk 1% = €10 on 4 pips means ~0.25 lots (€2.50 per pip). Target the next 15-minute micro-resistance at 1.08500, ~8 pips away — roughly 2:1.
- 6The higher chart gave you the direction and the level; the lower chart gave you the tight 4-pip stop. Neither alone is a trade.
Common mistakes with multi-timeframe scalping
- Trading the 1-minute in isolation. Without higher-timeframe context every wiggle looks like a signal. The lower chart is a trigger, never a compass.
- Taking a lower-timeframe buy into higher-timeframe resistance. A perfect 1-minute setup straight into a 1-hour wall is a trap, not an entry.
- Using timeframes that are too close together. A 5-minute 'context' chart for a 3-minute entry adds nothing. Keep a real gap — e.g. 15M/1M or 1H/5M.
- Flipping bias every candle. If you redraw your higher-timeframe direction each time the 1-minute ticks against you, you have no bias at all.
- Watching six charts and forcing trades on all of them. More screens means more temptation, not more edge. Most of the session you should be doing nothing.
Direction from the higher timeframe, entries from the lower — a scalp aligned with the bigger picture has the odds tilted its way.