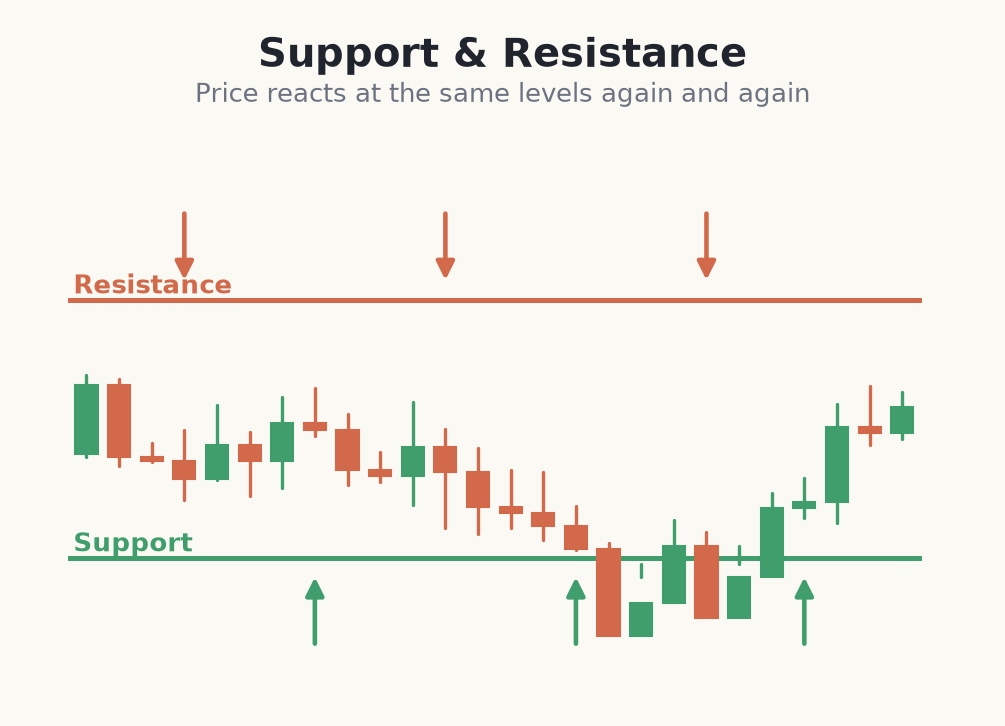
Support and resistance are the most important concepts in all of price action — almost every other setup is built on top of them. Support is a price area where buyers have historically stepped in and stopped price from falling further. Resistance is where sellers have stepped in and capped a rise. They are areas, not exact lines — think of them as zones a few pips wide where the balance of buyers and sellers has flipped before.
Why levels form in the first place
Levels form because market participants remember prices. Three groups create the reaction every time price returns: traders who bought at a level want to defend it and add; traders who missed the last move from that level want a second chance to enter; and traders who are trapped on the wrong side want to exit at breakeven. This collective memory concentrates fresh orders at the same prices, which is why the same level gets respected again and again — until it doesn't.
How to draw levels that actually matter
Drop to a higher timeframe first (daily or 4-hour) and mark only the prices where price has clearly reversed more than once. Use the area where candle bodies and wicks cluster, not a single wick tip. The strongest levels are the ones price has touched several times, and the very best are those that have acted as both support and resistance at different times. Keep it clean — a handful of strong levels beats twenty weak ones that turn your chart into spaghetti.
- <strong>More touches</strong> usually mean a more significant level — but each touch also drains a little strength from it.
- <strong>Round numbers</strong> (whole figures like 1.1000 or 2000) often act as psychological levels even with no prior touch.
- Treat levels as <strong>zones a few pips wide</strong>, not a single pixel — the market rarely turns on the exact price twice.
- A level broken with conviction can <strong>flip role</strong> (old resistance becomes new support) — see the Retest module.
How to trade a level, step by step
You never buy support just because price touched it — you wait for proof that buyers are actually defending it, then trade with a stop just beyond the zone so your risk is small and defined.
Buying a support bounce with a defined stop
- 1On the 4-hour EUR/USD chart you mark a support zone at 1.0800 — price has bounced there twice already.
- 2Price sells off into 1.0800 and you wait. You do not buy the touch; you wait for a bullish rejection candle (a long lower wick or a strong green close) to confirm buyers are stepping in.
- 3That confirmation candle closes at 1.0820. You enter a long there.
- 4You place your stop just below the zone at 1.0785 — a break there means support failed and your reason for the trade is gone. Risk = 35 pips.
- 5You target the resistance overhead at 1.0960 for roughly 140 pips of potential reward — about a 4:1 reward-to-risk before costs.
- 6With a €2,000 account risking 1% (€20) on a 35-pip stop, you size around 0.05 lots, and your plan is complete before you click buy: entry 1.0820, stop 1.0785, target 1.0960.
Common beginner mistakes with support & resistance
- Buying the exact touch with no confirmation. Price often pokes through a zone before turning. Wait for a rejection candle instead of front-running the level.
- Drawing too many levels. If everything is a level, nothing is. Keep only the prices a stranger would circle at a glance.
- Placing the stop inside the zone. A level is a zone, so a stop one pip below the line gets clipped by normal noise. Put it beyond the whole zone.
- Treating a level as permanent. Every level eventually breaks. When price closes firmly through it with a big body, stop fading it and respect the break.
- Ignoring the higher timeframe. A level that looks strong on the 5-minute may sit in the middle of nowhere on the daily. Anchor levels on the higher timeframe first.
Support and resistance are zones of memory where buyers or sellers have acted before — wait for proof they are acting again, then trade with a stop just beyond the zone.