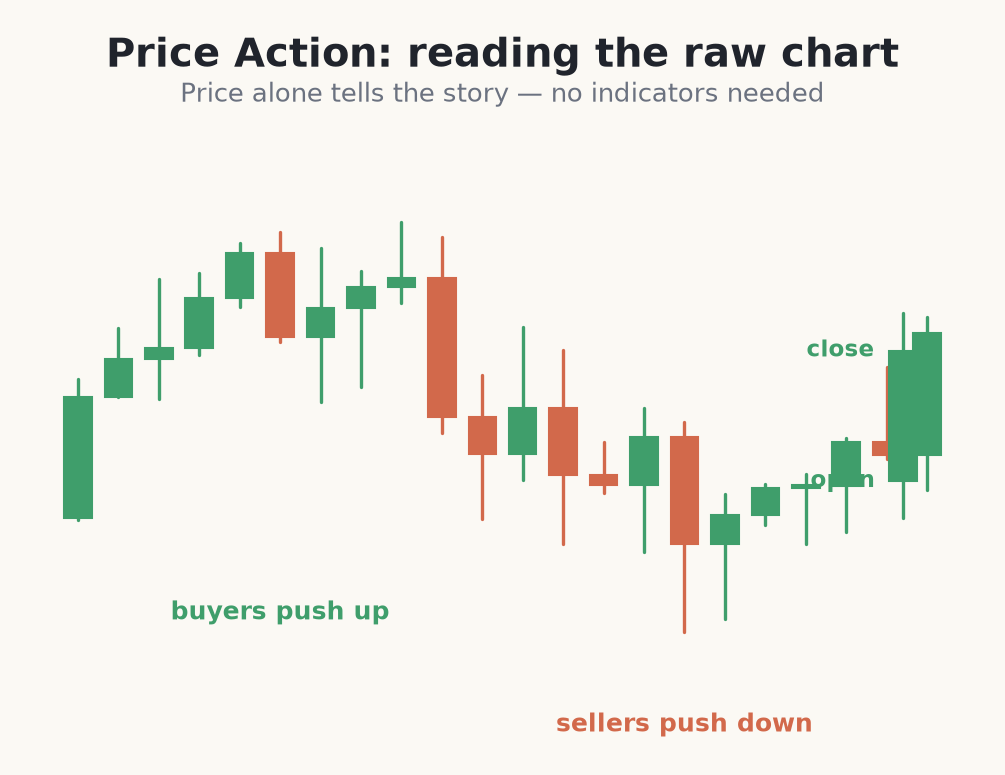
Price action is the study of how price moves over time, read directly from the chart itself. Instead of stacking indicators on top of each other, a price action trader reads candles, swings, and levels to understand one thing: the ongoing fight between buyers and sellers. Every candle is a receipt for that fight over a fixed period — its open, high, low and close tell you where the battle started, how far each side pushed, and who won by the close.
What price action actually is
At its core, a market is an auction. Buyers bid prices up when they are eager; sellers offer prices down when they want out. A single candle is a snapshot of that auction: a long green body means buyers dominated the whole period, a long black body means sellers did, and a small body with long wicks means both sides fought and neither won. You are not predicting the future — you are reading who is currently winning and betting they keep winning until proven otherwise.
Why read raw price instead of indicators?
Almost every indicator is just math applied to price — a moving average is the average of past closes, RSI is a ratio of past gains to losses. Because they are built from history, they lag behind what price is already showing you on the chart. By reading price directly you react to the market as it happens rather than to a smoothed, delayed echo of it. This does not make indicators worthless, but it does mean price is the primary source and everything else is a derivative. Learn to read the source first.
The mechanism is simple: at every price, someone is willing to buy and someone is willing to sell. Where buyers overpower sellers, price rises; where sellers overpower buyers, price falls. Your entire job as a price action trader is to find the few spots where one side is clearly in control and the potential reward is larger than the risk you must take to find out.
The three tools you actually need
- <strong>Candles</strong> — the open, high, low and close of each period. Body size and wick length tell you conviction: a big body is strength, a long wick is rejection.
- <strong>Swings</strong> — the highs and lows that price prints. Read left to right, they reveal the trend and its turning points (covered in Market Structure).
- <strong>Levels</strong> — prices where the market has reacted before and may react again. Support, resistance, and supply/demand zones are all levels.
- <strong>Context</strong> — the bigger picture. The same candle means different things in an uptrend versus a range, so higher-timeframe context decides whether a signal is worth taking.
How to read a bare chart, step by step
Reading price is a routine, not a talent. When you open any chart, run the same three questions every time and the story appears on its own.
Reading a fresh chart from scratch
- 1Strip the chart. Remove every indicator so you see nothing but bare candles. If you feel lost without them, that is exactly the skill this course builds.
- 2Read the trend. Scan left to right and ask: are the peaks and troughs generally rising, falling, or flat? Rising = uptrend (favour buys), falling = downtrend (favour sells), flat = range (wait or fade the edges).
- 3Read the last few candles. Are the recent bodies big or small? Big green bodies into a high = buyers in control; long upper wicks at a high = buyers being rejected. Conviction lives in the bodies, hesitation lives in the wicks.
- 4Mark the one level that matters. Find the nearest price the market has clearly reacted to before and note it. That single reference level is where your next decision will happen.
- 5Say the state out loud: "uptrend, big bullish bodies, holding above the last swing low — I am only looking for buys near support." If you cannot say a clean sentence like that, there is no trade yet.
Price action is reading the market from the chart itself — the raw, real-time story of buyers versus sellers, told by candles, swings and levels.
Turning a bare-chart read into a sized trade
- 1On the 1-hour EUR/USD chart you read the state: rising swings, big green bodies, price holding above the last swing low at 1.0820 — an uptrend, so you only look for buys.
- 2Price pulls back to your reference level near 1.0840 and prints a long lower wick — rejection, buyers stepping back in. You enter long at 1.0850.
- 3Your stop goes just below the swing low at 1.0815 — a close there means the uptrend read was wrong. Risk = 35 pips.
- 4Account is €1,000 and you risk 1% = €10. With a 35-pip stop, you size so 35 pips against you costs ~€10 — about 0.028 lots on EUR/USD.
- 5You target the next resistance near 1.0960, ~110 pips away — roughly 3:1 reward-to-risk. The plan is complete before you click: entry 1.0850, stop 1.0815, risk €10.
- 6One rule, no debate: a close below 1.0815 and you are out. The read gave you a direction; risk management gave you a way to survive being wrong.
Common beginner mistakes when starting out
- Drowning the chart in indicators. Five overlapping tools do not add five edges — they add noise and conflicting signals. Start bare and add at most one thing only once you know why.
- Treating price action as magic. It is not a crystal ball. It tells you who is winning now, not what happens next with certainty. Every read is a probability, never a promise.
- Reading candle-by-candle with no context. A single bullish candle in a strong downtrend is usually just a bounce to be sold. Always zoom out and read the trend before reacting to one candle.
- Skipping risk management because 'the read looks obvious'. The cleanest-looking setups still fail regularly. No amount of chart-reading skill removes the need for a stop and a sensible position size.
Throughout this course we build from the ground up: levels, then structure, then repeatable setups, and finally a written plan. No setup wins every time, so risk management matters as much as chart reading — a point we return to in every single module. Master the reading, but never trade without a defined level where you are wrong.