Market structure is the skeleton of price action. Before you think about a single trade, you read structure to answer one question: who is in control right now — buyers, sellers, or nobody? Get this wrong and every other tool you own points the wrong way. Get it right and you already have an edge, because you are trading in the direction the market is actually moving.
Structure is built from just two things: swing highs and swing lows. A swing high is a peak that has a lower candle on each side of it — price pushed up, ran out of buyers, and turned down. A swing low is the mirror image: a trough with a higher candle on each side, where price fell, ran out of sellers, and turned back up. Every trend, no matter how complex it looks, is just a chain of these two points.
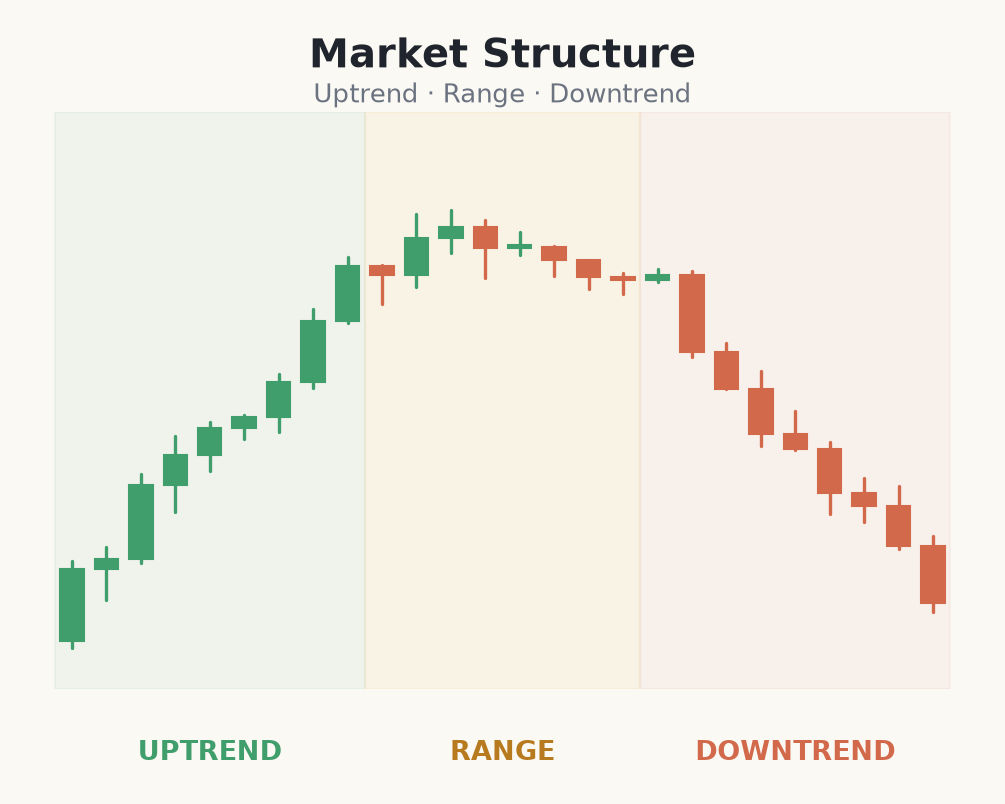
The three states of a market
A market is only ever doing one of three things. Learn to name the state out loud before you do anything else — it forces you to trade the chart in front of you instead of the one you wish you had.
- <strong>Uptrend</strong> — higher highs (HH) and higher lows (HL). Each rally clears the last peak, each dip stops above the last trough. Buyers are in control: look for buys, ignore sells.
- <strong>Downtrend</strong> — lower highs (LH) and lower lows (LL). Each drop breaks the last low, each bounce fails below the last peak. Sellers are in control: look for sells, ignore buys.
- <strong>Range</strong> — highs and lows are roughly level. Price bounces between a ceiling and a floor. Neither side is in control: either trade the edges, or stand aside until it breaks.
How to mark structure on a live chart
This is where most guides stop and most beginners get stuck. Marking structure is a mechanical routine, not an art. Follow the same steps every time and the trend names itself.
Reading a chart step by step
- 1Zoom out first. Drop to a higher timeframe (e.g. the 4-hour or daily). Structure on a 1-minute chart is noise; structure on the daily is the real trend everyone is reacting to.
- 2Find the obvious peaks and troughs. Mark every clear swing high (peak with a lower candle each side) and swing low (trough with a higher candle each side). Ignore tiny wiggles — you want the points a human would circle at a glance.
- 3Read them left to right. Ask: is each new high above the last high? Is each new low above the last low? Two yeses in a row = uptrend.
- 4Name the state out loud: "higher highs and higher lows — this is an uptrend, I only look for buys." If the highs and lows are flat, say "range — I wait or fade the edges."
- 5Mark the most recent swing low (in an uptrend). That level is your line in the sand: while price holds above it, the uptrend is intact. If price closes firmly below it, the structure has changed and your bias is no longer valid.
Why the last swing point is your objective invalidation
The single most practical use of structure is that it gives you a non-negotiable exit decided by the market, not by your emotions. In an uptrend, the most recent higher low is the level that must hold. If it breaks, buyers have failed to defend their last footprint — the reason you were long has gone. This is how structure turns into a real, sizable trade with a defined risk.
Turning structure into a sized trade
- 1You spot an uptrend on EUR/USD: price made a higher low at 1.0850 and is now pulling back toward it.
- 2You decide to buy the hold of that higher low, entering at 1.0870.
- 3Your invalidation is a close below the swing low, so you place your stop just under it at 1.0840 — a 30-pip risk.
- 4Your account is €1,000 and you risk 1% = €10. With a 30-pip stop, you size the position so that 30 pips against you costs about €10 — roughly 0.03 lots on EUR/USD.
- 5You now have a complete plan before entering: entry 1.0870, stop 1.0840, risk €10, and a clear rule — if 1.0840 breaks, the uptrend is over and you are out, no debate.
Notice what happened there: structure didn't just tell you the direction, it told you exactly where to be wrong. That is the whole point. A trade without a structural invalidation is a hope; a trade with one is a plan.
Common beginner mistakes with structure
- Reading structure on too low a timeframe. A 1-minute chart flips between 'uptrend' and 'downtrend' every few minutes. Anchor your bias on a higher timeframe first, then zoom in only to time entries.
- Forcing a trend that isn't there. If highs and lows are flat, it's a range — not 'about to break out'. Trading a range as if it were a trend is one of the fastest ways to get chopped up.
- Fighting the structure. Buying in a clean downtrend because it 'looks cheap' is trading your opinion against the market's proof. Trade with structure until you have real experience.
- Moving your invalidation. When price nears the swing low that should get you out, it's tempting to slide the stop lower 'to give it room'. That's just choosing to lose more. The level was objective when you set it — respect it.
- Marking every wiggle as a swing. Over-marking turns the chart into spaghetti. Only mark the peaks and troughs a stranger would circle at a glance.
Trade with structure, not against it
The single most useful habit in all of price action is to favour longs in an uptrend and shorts in a downtrend. Counter-trend trading is possible, but it is statistically harder and demands precise timing you won't have as a beginner. Master trend-aligned trading first: it lets the overall drift of the market work for you instead of against you.
Read the swings first. Structure tells you whether to be looking for buys, sells, or nothing at all — and it hands you the exact level where you're proven wrong.