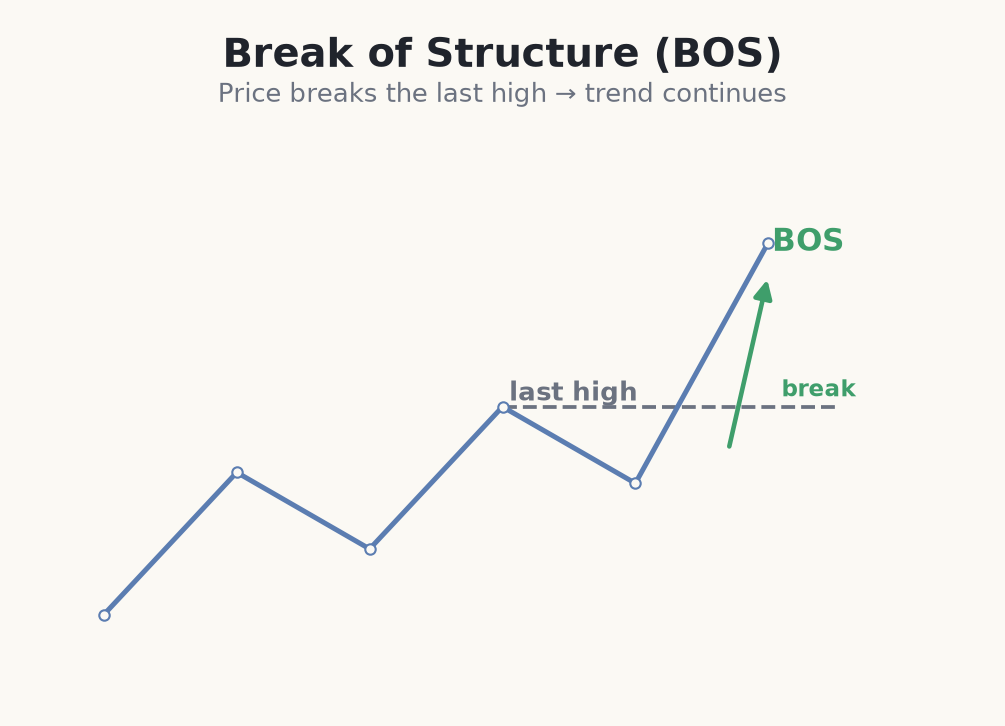
A break of structure, or BOS, is the market re-confirming the trend that is already in motion. In an uptrend, a BOS is a decisive break above the last swing high; in a downtrend, it is a break below the last swing low. Nothing about the trend has to change for a BOS to happen — it is simply price completing another leg in the same direction and leaving fresh proof that the side in control is still winning. It is the market's way of ticking off another rung on the staircase.
Why it matters: a trend is nothing more than a chain of broken swing points. Each time buyers push price above the previous peak, they print a new higher high, and the uptrend earns the right to continue. A BOS is the exact moment that proof arrives. Until it does, a pullback is just a pullback — it could be the pause before continuation, or the start of a reversal. The BOS resolves that ambiguity in the trend's favour and tells you it is safe to keep hunting entries in the trend direction.
How to spot a BOS on a live chart
Spotting a BOS is a mechanical routine, not a judgement call. First, name the trend on a higher timeframe. Second, mark the last relevant swing — the most recent higher high in an uptrend, or lower low in a downtrend. Third, watch that level: the BOS is a candle body that closes clearly beyond it in the trend direction. If you find yourself squinting to decide whether a level broke, it probably didn't — a real BOS is obvious.
BOS versus CHoCH — same event, opposite meaning
The most common confusion is between a BOS and a change of character (CHoCH). The mechanics are identical — price breaks a swing point — but the direction decides everything. A BOS breaks a swing in the direction of the existing trend and confirms continuation. A CHoCH breaks a swing against the trend and warns of a possible reversal. Read them as a pair: BOS tells you the trend is healthy, CHoCH tells you its character just cracked.
- <strong>Uptrend BOS</strong> — a close above the last higher high. Buyers still in control; keep looking for longs.
- <strong>Downtrend BOS</strong> — a close below the last lower low. Sellers still in control; keep looking for shorts.
- <strong>CHoCH (contrast)</strong> — the first break against the trend. Not a BOS; it is a warning, covered in its own module.
Demand a close, not a wick
The single most useful filter is to require a candle close beyond the swing point, not just a wick poking through it. Wicks through levels are extremely common — they are stop-runs and liquidity grabs that snap straight back. A body that closes clearly beyond the level tells you the break was accepted, not rejected. Beginners who count every wick as a BOS end up chasing dozens of fake breaks; traders who wait for the close trade far fewer, far cleaner ones. On lower timeframes, some traders demand two closes beyond the level for extra confidence.
How to use a BOS in a real trade
A confirmed BOS gives you two things: a direction to trade and a fresh swing low (or high) to define your risk against. The play is not to chase the breakout candle but to wait for the pullback it usually produces, then enter with your stop parked just beyond the new structural point. That way the trade is sized off a real level the market just drew, not a round number you guessed.
Turning a BOS into a sized EUR/USD trade
- 1On the 4-hour EUR/USD chart, mark the last swing high of the uptrend at 1.0850 — the peak price must clear.
- 2Price pulls back and makes a fresh higher low at 1.0810, holding above the previous higher low. Structure is intact.
- 3A strong bullish candle rallies and closes at 1.0872, well above 1.0850 — not the earlier wick that only tagged 1.0853. That close is your confirmed BOS.
- 4You wait for the pullback rather than chasing. Price drifts back to the broken 1.0850 level, which flips to support, and you enter on the hold at 1.0858.
- 5Stop below the fresh higher low at 1.0828 — a 30-pip risk. On a €1,000 account risking 1% (€10), a 30-pip stop sizes to roughly 0.03 lots.
- 6Target the measured next leg near 1.0918 (60 pips) — about a 2:1 reward-to-risk trade built entirely around the BOS. One rule: a close back below 1.0828 and you're out.
Why chasing the break is the weakest entry
The candle that makes the BOS is usually the worst place to enter: it is extended, your stop has to sit far away back below the swing, and you are buying right where short-term traders take profit. The higher-quality play is to let the BOS confirm the trend, then wait for the retracement. The broken level often becomes support (or resistance in a downtrend), giving you a tighter stop and a much better reward-to-risk — the same role-flip idea covered in the Retest module.
Common mistakes with break of structure
- Counting wicks as breaks. A wick through the swing high is not a BOS. Wait for a body to close beyond it, or you'll be trapped by every stop-run.
- Confusing BOS with CHoCH. A break with the trend confirms it; a break against the trend warns of reversal. Always ask which direction the broken swing sits relative to the trend.
- Chasing the breakout candle. Entering on the extended BOS candle puts your stop miles away and buys into profit-taking. Prefer the pullback after the break.
- Marking the wrong swing. The BOS is about the last relevant swing, not a random old high. Mark the peak a stranger would circle at a glance.
- Ignoring the higher timeframe. A BOS on the 1-minute chart means little if the daily is in a strong opposing trend. Anchor the trend on a higher timeframe first.
A break of structure re-confirms the trend — price closes beyond the last swing in the trend's own direction. Demand a close, not a wick, and prefer entering the pullback that follows over chasing the break itself.