What it is: Harmonic patterns are geometric price structures whose legs conform to specific Fibonacci ratios. Instead of eyeballing a shape, harmonic traders measure each leg and only trade the pattern when its proportions fall within tight tolerances. The reward is a precise reversal zone with clearly defined risk.
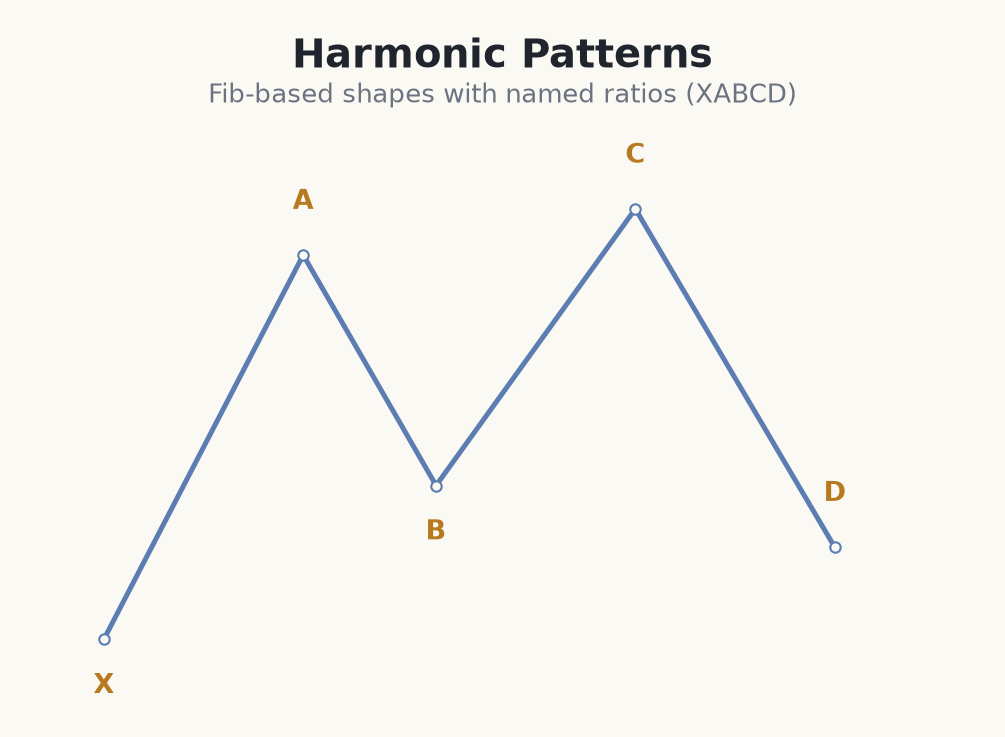
The XABCD structure
Nearly all harmonic patterns share the same skeleton: five points labelled X, A, B, C and D, forming four legs (XA, AB, BC, CD). Point D is the potential reversal zone (PRZ) — the price where the pattern completes and a trade is considered. What separates a Gartley from a Bat or a Crab is simply the ratio each leg must meet.
The universal trade idea is to enter at D in the direction opposite to the CD leg, expecting a reversal, and to place a stop beyond X. If price pushes through X, the pattern has failed and the structure no longer holds — a clean, objective invalidation point.
- X, A, B, C, D — four legs and one completion point.
- D is the potential reversal zone where you consider a trade.
- Entry at D, targeting a retrace of the CD or AD leg.
- Stop beyond X — the level that invalidates the whole pattern.
Why the ratios matter — and their limits
Why it works: the appeal is objective risk. Because every leg must hit a ratio and D is a precise price, you know your entry, stop and invalidation before the pattern even completes — no guessing. The reversal itself is counter-trend, so the tight geometry is what makes the reward worth the risk. But be honest: harmonic patterns are counter-trend reversal bets, they are subjective to spot, and plenty complete then fail. The ratios define the trade; they do not guarantee the reversal.
Anatomy of a bearish XABCD short — EUR/USD (€1,000)
- 1You spot a five-point structure on EUR/USD 1-hour: X = 1.0700, A = 1.0850, B = 1.0757 (a 61.8% retrace of XA), C = 1.0810, and price now approaching D near 1.0870.
- 2D projects just beyond X's opposite side and completes the pattern's ratios. The PRZ is 1.0868–1.0875. You wait — a pattern is not a trade until D reacts.
- 3Price tags 1.0872 and prints a bearish engulfing candle — confirmation at D for a short (opposite the up CD leg).
- 4Entry 1.0865, stop beyond the structure at 1.0895 = 30 pips. Risk 1% of €1,000 = €10, size ≈ 0.033 lots (~€0.33/pip).
- 5Target a retrace of CD toward C at 1.0810 (~55 pips, ~1.8:1) then A at 1.0850. If price closes beyond the invalidation, the pattern failed — you take the small loss, no debate.
Common harmonic-pattern mistakes
- Forcing the ratios. If B is at 55% and the pattern needs 61.8%, it is not that pattern. Loose tolerances turn harmonics into wishful drawing.
- Entering at D with no reaction. D is a potential reversal zone, not a signal. Wait for a rejection or structure shift before committing.
- Trusting the shape over the stop. A textbook pattern still fails often. The stop beyond X is the whole risk model — never widen or remove it.
- Ignoring that it is counter-trend. You are betting on a reversal against the CD leg. Respect that these are lower-probability, higher-R:R trades.
- Over-trading messy structures. Not every wiggle is a Gartley. If you have to squint, there is no pattern.
Harmonic patterns are XABCD shapes defined by Fibonacci ratios — enter at D, target a retrace, and place the stop beyond X.
Be realistic: harmonic patterns are subjective to identify and no pattern completes perfectly every time. Treat the ratios as tolerances, always wait for confirmation at D, and never abandon your stop just because the shape looked textbook.