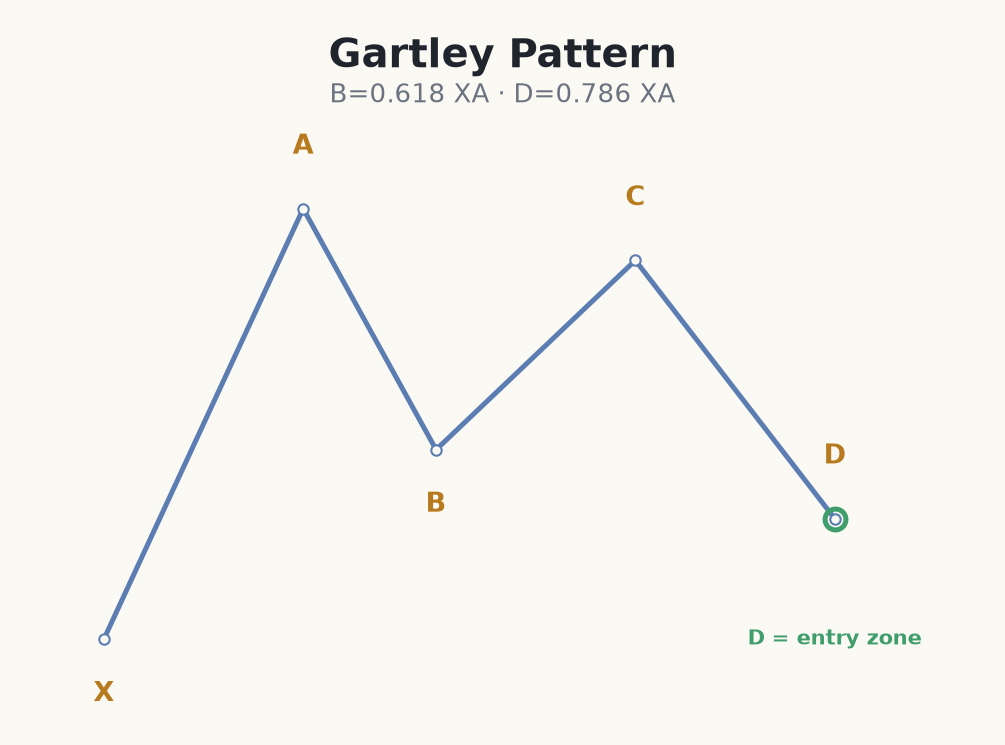
What it is: The Gartley is the original harmonic pattern, and its D-point sits inside the prior XA move, making it the most conservative of the family. It looks like a stretched 'M' or 'W' and represents a deep pullback that completes just before the trend is expected to resume.
Defining ratios
- B retraces 61.8% of the XA leg.
- BC retraces 38.2% to 88.6% of AB.
- CD extends 127.2% to 161.8% of BC.
- D completes at 78.6% of XA — inside the XA range.
The signature of the Gartley is the 78.6% D-point: because D does not exceed X, the pattern stays contained within the original move. That containment is what makes it the safest harmonic to trade, though 'safest' still means it needs confirmation.
Trading the Gartley
How to use it: enter at point D in the direction of the original trend — long on a bullish Gartley, short on a bearish one — after a reaction confirms the level. Place the stop just beyond X; if price runs past X, the pattern is void. Targets are typically the C point and then the A point, often taken in stages.
Why it's the safest: because D at 78.6% stays inside XA, the pattern is really a deep trend-continuation pullback dressed in harmonic ratios — you are broadly with the larger move, not fighting a fresh extreme. That is why it fails less often than a Butterfly or Crab. 'Less often', not 'rarely' — the stop beyond X still does the real work.
Bullish Gartley long on GBP/USD (€1,000)
- 1GBP/USD prints a bullish Gartley: X = 1.2500, A = 1.2700 (XA = 200 pips), B = 1.2576 (61.8% of XA), C = 1.2650.
- 2D completes at 78.6% of XA = 1.2543 — inside the XA range. The PRZ is 1.2540–1.2548.
- 3Price dips to 1.2544 and prints a bullish pin bar — confirmation at D. Entry 1.2550.
- 4Stop just beyond X at 1.2490 = 60 pips. Risk 1% of €1,000 = €10, size ≈ 0.016 lots (~€0.16/pip).
- 5Target C at 1.2650 (~100 pips, ~1.6:1) taking half, then A at 1.2700 (~150 pips, ~2.5:1) for the rest. A close below 1.2490 voids the Gartley and you are out.
Common Gartley mistakes
- Accepting a loose B-point. The Gartley needs B near 61.8% of XA. If B is at 78.6%, you may be looking at a Butterfly — a different trade with a different stop.
- Letting D exceed X. If D pushes past X, it is no longer a Gartley (D must stay inside XA). Do not force the label onto a broken structure.
- Entering at D with no reaction. 'Safest harmonic' still means wait for a rejection candle. A blind limit at 78.6% catches the failures too.
- Removing the stop beyond X. Containment does not mean safety. Past X the pattern is void — respect the invalidation every time.
- Holding the full position to A. Price often stalls at C. Scaling out at C then A banks profit instead of round-tripping a winner.
The Gartley completes at 78.6% of XA with a 61.8% B-point — enter at D, stop beyond X, and target C then A.