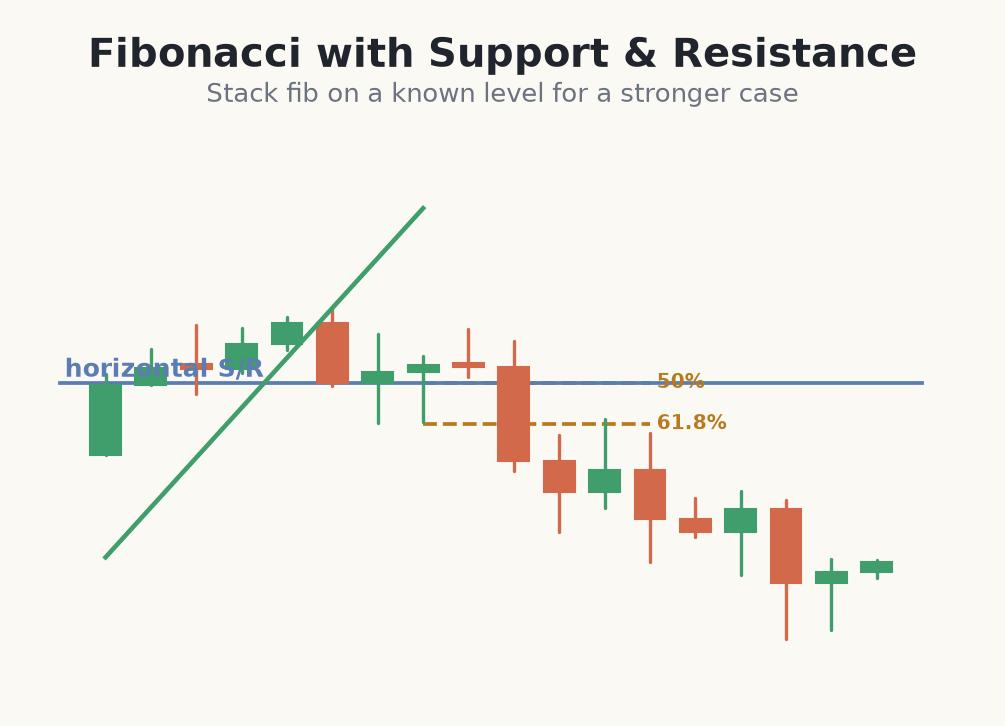
What it is: Horizontal support and resistance are the bedrock of price action, and Fibonacci layers neatly on top of them. When a retracement level lands exactly on a prior level that price has respected before, you get two independent reasons to expect a reaction at the same spot.
Why the combination works
Support and resistance are areas of market memory where buyers or sellers have acted before. Fibonacci levels are areas where pullbacks statistically stall. When memory and statistics agree, more traders place orders there, which makes the reaction more likely and often sharper — the essence of confluence from an earlier module.
How to trade the overlap
How to use it: mark your horizontal levels first from the higher timeframes, then draw the retracement. If a level such as 61.8% sits inside a known support zone, treat that as a primary decision area. Wait for a reaction — a rejection candle or a small structure shift — before entering, with a stop just beyond both the Fibonacci level and the horizontal zone.
- Draw horizontal support and resistance before the Fibonacci tool.
- Prioritise Fibonacci levels that sit on tested horizontal zones.
- Wait for a reaction candle rather than a blind limit order.
- Stop goes just beyond the combined zone, not inside it.
Order matters: levels first, Fibonacci second
Why the order matters: if you draw the Fibonacci first, you will unconsciously 'find' support wherever the 61.8% happens to land — that is confirmation bias, not analysis. Mark the horizontal levels before the tool touches the chart, using zones price has already respected, then see which Fibonacci level coincides. Genuine overlap is discovered, not manufactured.
Fibonacci-on-support long on USD/JPY (€1,000 account)
- 1On USD/JPY 4-hour, you first mark a well-tested horizontal support at 156.00 — price bounced there twice last month.
- 2The recent impulse ran from 155.50 up to 157.50 (200 pips). You draw the retracement: 50% = 156.50, 61.8% = 156.26, 78.6% = 155.93.
- 3The 78.6% (155.93) sits right on your 156.00 support — a genuine overlap you found, not forced. Price dips in and prints a bullish rejection at 156.00.
- 4Entry 156.10, stop below both the level and zone at 155.60 = 50 pips. Risk 1% of €1,000 = €10; on USD/JPY ~€0.06/pip per 0.01 lot, size ≈ 0.03 lots.
- 5Target the prior high at 157.50 (~140 pips) for about 2.8:1. Two reasons defended 156.00, so a break below 155.60 cleanly voids the idea.
Common Fibonacci-plus-S/R mistakes
- Drawing Fibonacci first, then 'finding' support. That is bias. Mark the horizontal zones before the tool so the overlap is genuine.
- Using untested horizontal levels. A line price has never reacted to is not support. Prioritise zones with a real reaction history.
- Treating the overlap as a guarantee. Two reasons raise the odds; they do not remove failure. Combined zones still break, so keep the stop.
- Placing the stop inside the zone. A stop between the Fibonacci level and the support gets nicked by normal noise. Put it just beyond the whole zone.
- Entering with no reaction candle. The overlap tells you where; a rejection or structure shift tells you when. Blind limits skip the confirmation.
A Fibonacci level sitting on tested support or resistance is far stronger than either signal alone.