What it is: A Fibonacci retracement measures how far price pulls back against a move. You anchor the tool to a clear swing and it divides that range into horizontal levels at 23.6%, 38.2%, 50%, 61.8% and 78.6%. Those levels become candidate areas where the pullback could end and the original trend resume.
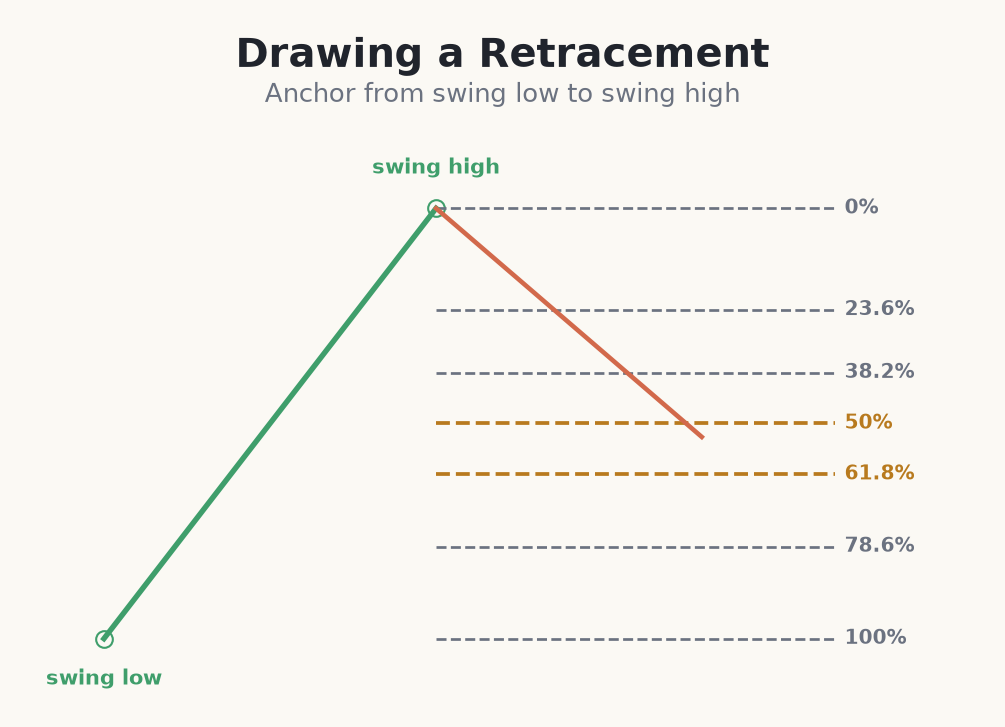
How to draw it correctly
In an uptrend, drag the tool from the swing low to the swing high: 0% sits at the high and 100% at the low, so the retracement levels fall in between as price pulls back. In a downtrend you reverse it, dragging from the swing high down to the swing low. The single most common mistake is anchoring to the wrong swings — pick obvious, clean swings, not minor wiggles.
Why the anchors decide everything
Why it matters: the levels are only as good as the two points you pin them to. Anchor to a swing everyone can see and your 61.8% lands where other traders' 61.8% lands — that shared level is where reactions happen. Anchor to a random intraday wiggle and your levels drift off into empty space where nobody else is watching, so nothing reacts. Wick or body? Be consistent: many traders use the extreme wick of the swing; whichever you choose, use it every time so your levels are reproducible.
Reading the levels
Shallow retracements to 23.6% or 38.2% suggest a strong, eager trend that barely pauses. Deeper pulls to 61.8% or 78.6% mean the counter-move is more serious, offering better entry prices but also a higher chance the trend is failing. The 50% level often acts as a psychological line in the middle.
- Anchor to clear, significant swings — not noise.
- Uptrend: low to high. Downtrend: high to low.
- The 38.2%–61.8% band is where most tradeable pullbacks stall.
- A close well beyond 78.6% warns the move may be reversing, not retracing.
Drawing and trading a retracement on GBP/USD (€1,000 account)
- 1GBP/USD trends up on the 4-hour, printing a clean swing low at 1.2500 and a swing high at 1.2700 — a 200-pip leg. Anchor the tool low-to-high.
- 2Levels print: 38.2% = 1.2624, 50% = 1.2600, 61.8% = 1.2576, 78.6% = 1.2543.
- 3Price drifts back and stalls in the 50%–61.8% band (1.2600–1.2576), printing a bullish engulfing candle at 1.2585. That is your confirmation to go long.
- 4Entry 1.2590, stop below the 78.6% and swing structure at 1.2540 = 50 pips. Risk 1% of €1,000 = €10, so size ≈ 0.020 lots (~€0.20/pip).
- 5Target the prior high at 1.2700 (~110 pips) for about 2.2:1. If price had closed below 1.2540, the pullback would have become a reversal and you would be flat — no debate.
Common drawing and reading mistakes
- Anchoring to minor wiggles. A retracement drawn off noise produces levels nobody else sees, so nothing reacts there. Use the obvious swing high and low.
- Mixing wick and body anchors. Snapping to the wick one time and the body the next makes your levels irreproducible. Pick one convention and keep it.
- Drawing the tool backwards. Low-to-high in an uptrend, high-to-low in a downtrend. Reverse it and your percentages read upside-down.
- Buying every touch with a blind limit. The 61.8% is a decision zone, not an automatic buy. Wait for a reaction candle before committing.
- Ignoring a close beyond 78.6%. That is the market telling you the move is reversing, not retracing — do not average down against it.
Draw retracements swing-to-swing on obvious highs and lows — the 38.2% to 61.8% zone is where most pullbacks find their footing.