What it is: Fibonacci trading applies a set of ratios derived from a famous number sequence to the swings on a chart. The idea is that after a strong move, price rarely retraces in a random way — pullbacks often stall near predictable percentages of the prior move before the trend resumes. Traders use these levels to plan entries, stops and targets, turning a fuzzy 'the dip looks good here' into a specific price with a specific reason.
Where the ratios come from
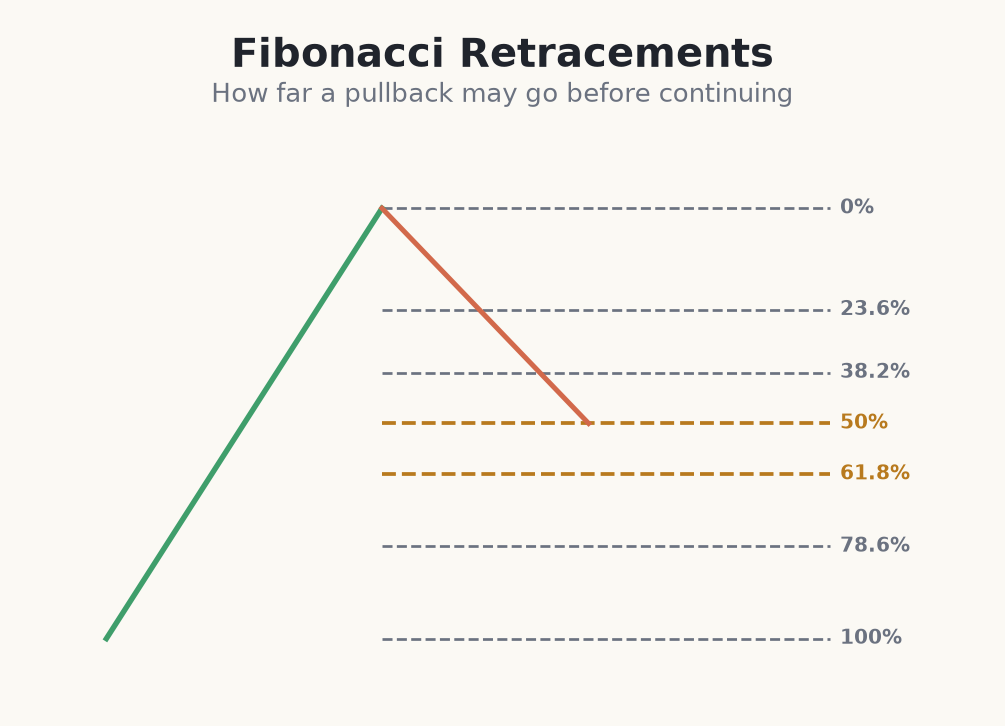
The Fibonacci sequence (1, 1, 2, 3, 5, 8, 13 …) produces ratios that recur throughout the tool. Dividing a number by the one after it approaches 0.618, giving the famous 61.8%; skipping one gives 38.2%; and 23.6% and 78.6% come from related divisions. The 50% level is not a true Fibonacci ratio at all, but it is included by convention because markets so often pull back to the midpoint of a move.
- 23.6% — a shallow pullback, common in strong trends.
- 38.2% — a moderate retracement.
- 50% — the midpoint; widely used but not a real Fibonacci number.
- 61.8% — the 'golden ratio', a deep and closely watched level.
- 78.6% — a very deep retracement, the last line before a full reversal.
Why these levels move price at all
Why it works: there is nothing mystical about a market obeying a medieval sequence. Fibonacci levels matter because thousands of traders watch them — retail platforms, prop desks and algorithms all draw the same 61.8% on the same swing. When enough orders cluster at one price, a reaction becomes partly self-fulfilling. The number does not cause the bounce; the crowd's shared attention does. That is also why levels work better on liquid, widely-followed markets than on thin, ignored ones.
How to read a level on a real chart
How to use it: a Fibonacci level is a decision zone, not a trigger. Price arriving at 61.8% tells you 'pay attention here', not 'buy now'. You still need a reason to act — a rejection candle, a structure shift, a confluence with support. Treat each level as a question ('are buyers defending this?') rather than an answer.
Reading a 38.2/50/61.8 retracement on EUR/USD (€1,000 account)
- 1On the 1-hour chart, price rallies from a swing low of 1.0800 to a swing high of 1.0900 — a clean 100-pip leg up. You drag the Fibonacci tool low-to-high.
- 2The tool prints levels: 38.2% = 1.0862, 50% = 1.0850, 61.8% = 1.0838. These are your candidate areas where the pullback might stall.
- 3Price pulls back and prints a long lower wick right at 1.0838 (the 61.8%) — the deep golden ratio, and buyers reject it. That is your reason to consider a long.
- 4Entry 1.0842, stop below the swing low at 1.0796 = 46 pips risk. Account €1,000, risk 1% = €10, so size ≈ 0.021 lots (46 pips × ~€0.21/pip ≈ €10).
- 5Target the prior high at 1.0900 (~58 pips) and beyond — roughly 1.25:1 here, modest; a shallower entry would have given worse geometry. The level gave structure to a trade that was otherwise a guess.
Fibonacci levels mark where pullbacks tend to stall — a probabilistic guide, not a magic price that price must obey.
Common mistakes with Fibonacci from day one
- Treating a level as a guarantee. Price is not obliged to stop at 61.8%. It reacts there more often than at a random price, but 'more often' is not 'always' — plan for the level failing.
- Placing a blind limit order at the number. Sitting a buy exactly at 61.8% with no confirmation means you get filled on every pullback, including the ones that keep falling straight through.
- Forgetting the 50% is not a real Fibonacci ratio. It works by convention and psychology, not maths — do not over-weight it just because it sits in the middle.
- Drawing on tiny wiggles. A retracement anchored to noise gives noise levels. Use obvious, significant swings that the whole market can see.
- Skipping the stop because 'the golden ratio always holds'. It does not. Every Fibonacci trade still needs a defined invalidation price and fixed risk.
It is worth being honest from the start: Fibonacci is a probabilistic tool, not a guarantee. Levels work partly because so many traders watch them, creating self-fulfilling reactions. Throughout this course we treat Fibonacci as one input among many, always combined with structure and strict risk management.