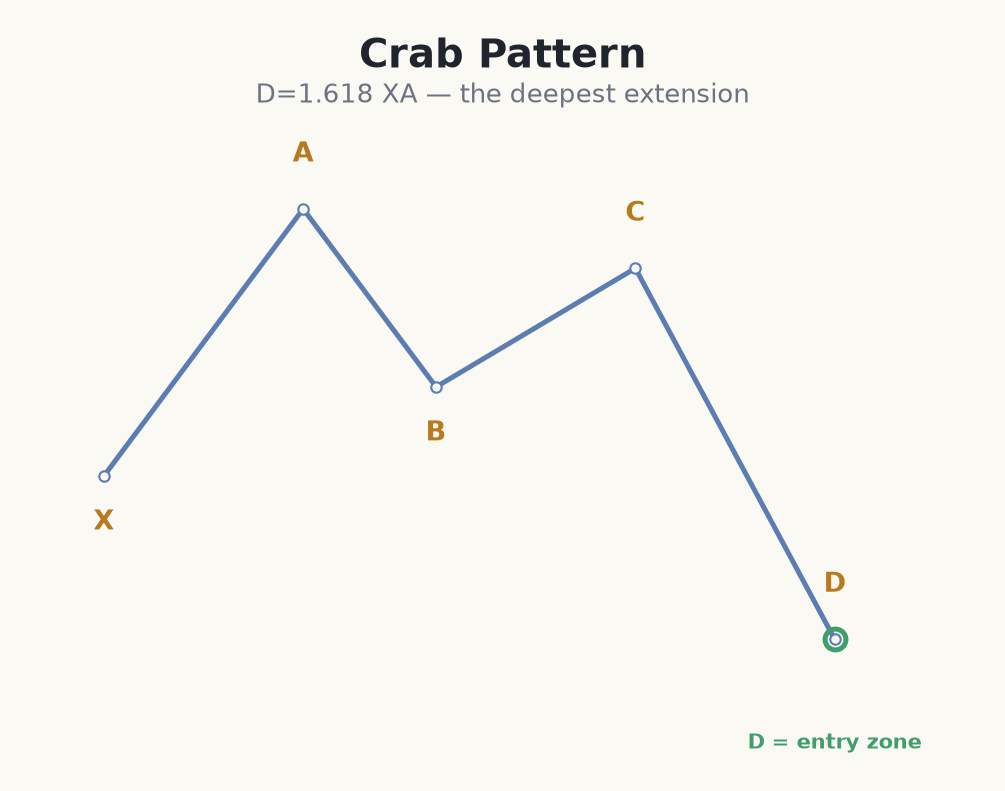
What it is: The Crab is the most extreme harmonic pattern, projecting its completion point far beyond X to the 161.8% extension of XA. It is designed to catch sharp reversals at deeply stretched extremes, where a move has run much further than usual and momentum is exhausted.
Defining ratios
- B retraces 38.2% to 61.8% of the XA leg.
- BC retraces 38.2% to 88.6% of AB.
- CD extends 261.8% to 361.8% of BC — a very long final leg.
- D projects to 161.8% of XA — the pattern's signature.
The Crab's hallmark is that long, sharp CD leg that drives D out to the 161.8% extension. Because the reversal is caught at such an extreme, the pattern can offer huge targets, but the extended move also means false completions are common.
Trading the Crab
How to use it: enter at D as the 161.8% zone shows rejection, with a stop just beyond D since it is already an extreme. The Crab can produce the best reward-to-risk of the harmonics because the stop is tight relative to the reversal target — but only if you wait for real confirmation and accept that fighting a strong move is risky by nature.
Why it's the riskiest: the Crab fades the most stretched extreme of the whole family — price has blown past X to 161.8% and you are betting it snaps back. When it works, the tiny stop past D and the huge move back give spectacular R:R. When it fails, the market was simply trending hard and you were standing in front of it. This is the pattern where confirmation and a firm stop matter most; without them it is just picking a top or bottom in a runaway move.
Bearish Crab short on EUR/USD (€1,000)
- 1EUR/USD prints a bearish Crab: X = 1.0700, A = 1.0600 (XA = 100 pips), B = 1.0638 (61.8% of XA), C = 1.0660.
- 2D projects to 161.8% of XA = 1.0762 — far beyond X, a deeply stretched high. The PRZ is 1.0758–1.0766.
- 3Price spikes to 1.0763 and prints a bearish pin bar — confirmation at the extreme. Entry 1.0758.
- 4Stop just beyond D at 1.0778 = 20 pips. Risk 1% of €1,000 = €10, size ≈ 0.050 lots (~€0.50/pip).
- 5Target C at 1.0660 (~98 pips, ~4.9:1) and A at 1.0600. Superb geometry — but you are fading a runaway high, so a close above 1.0778 means the trend won and you take the small loss immediately.
Common Crab mistakes
- Picking the top with no rejection. Fading a 161.8% extreme with no confirming candle is just guessing where a strong move ends. Wait for the rejection.
- Treating the R:R as free money. The tight stop looks amazing, but the Crab has the highest failure rate of the family. Great potential R:R ≠ high win rate.
- Averaging down when D is exceeded. If price closes beyond the stop, the move is still trending. Adding against it turns a small loss into a large one.
- Confusing it with a Butterfly. The Crab projects D to 161.8% of XA (further than the Butterfly's 127.2%) with a different CD extension. Check ratios before labelling.
- Over-sizing on the geometry. The temptation to bet big on 5:1 is exactly how extreme-reversal traders blow up. Keep fixed 1% risk.
The Crab projects D to 161.8% of XA — an extreme reversal trade with excellent reward-to-risk but a high need for confirmation.