What it is: The Bat is a deep retracement pattern that, like the Gartley, completes inside the XA move — but even deeper, at the 88.6% level. Its appeal is a very tight stop: because D sits so close to X, the invalidation point is only a short distance away, giving excellent reward-to-risk.
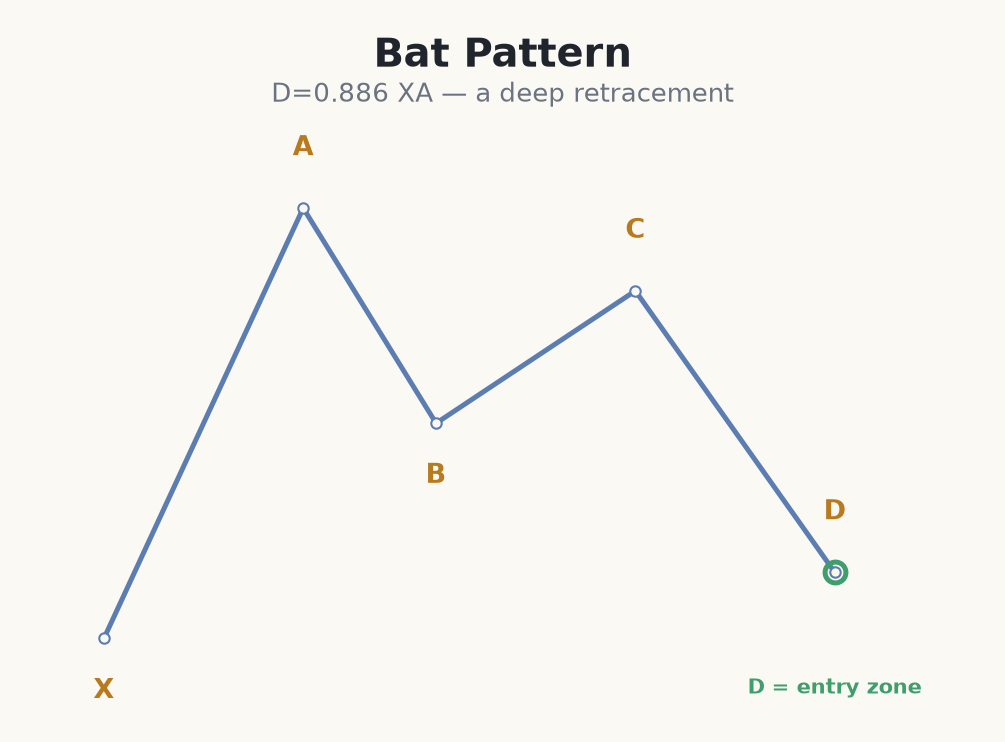
Defining ratios
- B retraces 38.2% to 50% of the XA leg — shallower than a Gartley.
- BC retraces 38.2% to 88.6% of AB.
- CD extends 161.8% to 261.8% of BC.
- D completes at 88.6% of XA — a deep but contained retracement.
The Bat is distinguished from the Gartley by its shallower B-point (38.2%–50% rather than 61.8%) and its deeper 88.6% D-point. That deep completion so near to X is exactly what enables the pattern's characteristically tight stop.
Trading the Bat
How to use it: enter at D in the trend's direction once the 88.6% level reacts, and place the stop just beyond X. Because X is close, the risk is small relative to the target back toward A, which is why the Bat is prized for its geometry. As always, wait for confirmation — a deep pullback that keeps going becomes a failed pattern.
Why the geometry is so good: D at 88.6% sits a hair inside X, so the distance from entry to the invalidation is tiny while the distance back to A is large. That naturally produces a high reward-to-risk — often 3:1 or 4:1. The flip side: 88.6% is so deep that the trend is under real strain, so the pattern fails more than its clean geometry suggests. The tight stop and confirmation are what make the maths work over many trades.
Bullish Bat long on GBP/USD (€1,000)
- 1GBP/USD prints a bullish Bat: X = 1.2600, A = 1.2800 (XA = 200 pips), B = 1.2700 (50% of XA — shallow), C = 1.2760.
- 2D completes at 88.6% of XA = 1.2623 — deep, but still inside X. The PRZ is 1.2620–1.2628.
- 3Price dips to 1.2624 and prints a bullish engulfing — confirmation at D. Entry 1.2628.
- 4Stop just beyond X at 1.2590 = 38 pips. Risk 1% of €1,000 = €10, size ≈ 0.026 lots (~€0.26/pip).
- 5Target C at 1.2760 (~132 pips, ~3.5:1) taking half, then A at 1.2800. The tight 38-pip stop next to X is the Bat's whole edge — a close below 1.2590 voids it.
Common Bat mistakes
- Confusing it with a Gartley. The Bat needs a shallow B (38.2%–50%) and a deep 88.6% D. A 61.8% B is a Gartley — different D, different plan.
- Widening the stop past X. The entire advantage is the tiny X-to-D gap. Widen the stop and you throw away the reward-to-risk you came for.
- Trusting the deep entry without confirmation. 88.6% is nearly a full reversal. If the trend is dying, price sails through — wait for the reaction candle.
- Chasing a late fill. Enter near 88.6%, not after price has already bounced 30 pips. A late entry ruins the geometry.
- Over-leveraging on the R:R. Great geometry tempts oversizing, but deep patterns fail often. Fixed 1% risk, always.
The Bat completes at 88.6% of XA with a shallow B-point — its closeness to X allows a tight stop and strong reward-to-risk.