The Wyckoff method is a framework for reading price and volume together to judge where the balance of supply and demand is shifting. Developed by Richard Wyckoff in the early twentieth century, it treats the market as a cycle that repeats across timeframes rather than a series of random moves.
The four-phase cycle
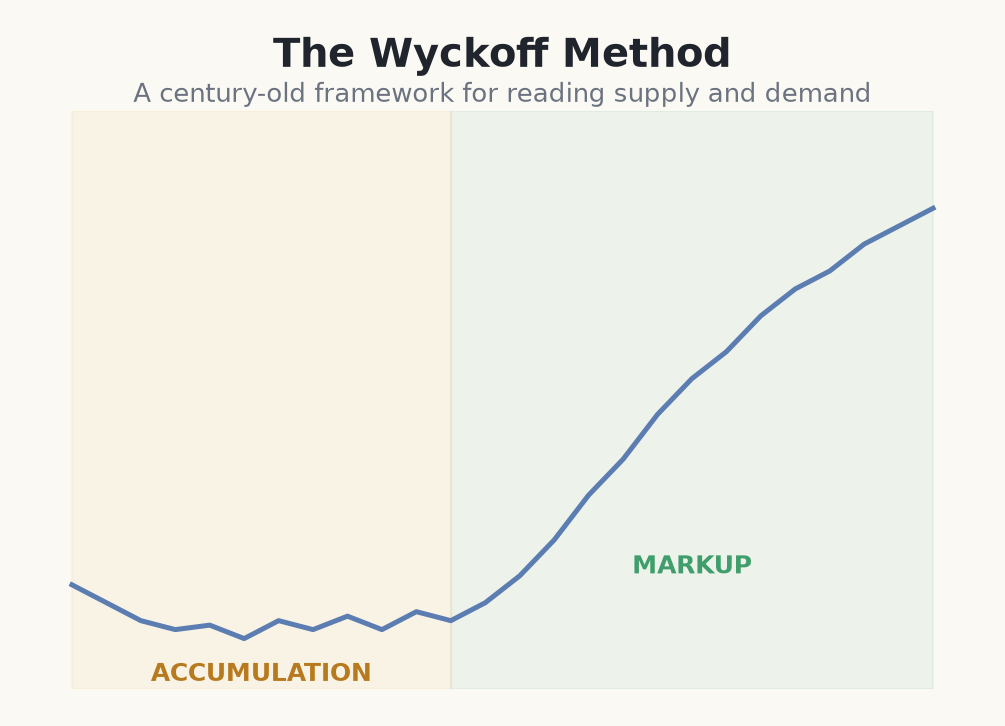
Wyckoff described price as moving through four repeating stages. Large operators accumulate quietly at low prices, drive a markup as demand takes over, then distribute their holdings near highs before a markdown carries price back down. The cycle then begins again at a new level.
- Accumulation: a sideways range where buying absorbs supply.
- Markup: an uptrend as demand overpowers supply.
- Distribution: a sideways range where holdings are sold into strength.
- Markdown: a downtrend as supply overpowers demand.
Why the cycle exists
The cycle exists because large positions cannot be built or unwound instantly. Someone who wants to buy a huge amount cannot simply lift every offer without spiking the price against themselves; they must buy patiently while sellers are still willing to hand over stock cheaply. That patient buying is accumulation. The same constraint in reverse — you cannot dump a huge position into a thin market without crashing it — is what forces distribution to happen slowly, sideways, near the highs. Wyckoff read the sideways ranges as the real work and the trends as the payoff.
How to spot which phase you are in
The fastest orientation is to ask what came before the current sideways action. A range that follows a long decline and forms near obvious lows is a candidate for accumulation; a range that follows a long rally and forms near highs is a candidate for distribution. Then read volume: absorption near the lows (heavy selling that fails to push price lower) hints at accumulation, while stalling rallies near the highs (buying that fails to make new highs) hint at distribution. The phase is a hypothesis you keep testing, not a label you stamp once.
How to use the cycle in practice
You do not trade the cycle by predicting it — you trade by positioning with it once it confirms. In accumulation you look for buys only after a sign of strength; in distribution you look for shorts only after a sign of weakness. The cycle gives you a bias and a place to be patient. The individual events inside each phase — springs, upthrusts, tests — give you the actual entries, and every one of them still needs a stop.
Reading the cycle on a fresh chart
- 1On the daily chart of a stock you see a long decline into €18.00, then six weeks of sideways chop between €18.00 and €20.00. The prior downtrend plus the low location makes this a candidate accumulation range.
- 2You check volume: the dips to €18.00 come on shrinking volume while the last dip barely undercut the low and snapped back. That absorption tells you sellers are running out — the phase read strengthens.
- 3A wide, high-volume rally then breaks up through €20.00 to €20.60 — a sign of strength signalling the markup may be starting. You do not chase it.
- 4You wait for the pullback. Price eases back to €20.10 and holds above the old range top on light volume — a higher low. You buy there, entry €20.10, stop under the pullback low at €19.60 (risk €0.50 per share).
- 5Account €1,000, risking 1% = €10. With €0.50 risk per share you buy about 20 shares (€402 notional). A move back toward the cause-based target near €22.00 would be roughly 3.8:1.
- 6One rule: a daily close back below €19.60 means the markup read was wrong and you are out — the cycle gave the bias, the stop keeps being wrong cheap.
Wyckoff frames the market as a repeating cycle — accumulation, markup, distribution, markdown — driven by the balance between supply and demand.
Common beginner mistakes with the Wyckoff cycle
- Forcing every range into a phase. Plenty of sideways action is just noise that breaks either way. If the prior trend and the volume behaviour don't line up, there is no clean phase — leave it alone.
- Trading the phase before it confirms. Buying inside a 'looks-like-accumulation' range before any sign of strength is guessing. Wait for the markup to actually begin.
- Treating the tidy schematic as reality. The four-phase diagram is idealised. Real charts skip steps, extend for months, and fake you out — the cycle is a lens, not a template price obeys.
- Confusing distribution with re-accumulation. A range near highs can resolve up just as easily as down. Never short a 'top' until weakness is confirmed.
- Dropping stops because the story feels obvious. A convincing cycle read does not remove risk. Every entry still needs a defined level where you are wrong and a small position size.
Across this course we build from the underlying logic — the composite operator and the three laws — up to reading full ranges and timing entries with springs and upthrusts. No phase resolves the same way every time, so risk management stays essential throughout.