Cumulative delta takes the per-bar delta and adds it up over time into a single running line. Where delta shows the buying-versus-selling balance of one bar, cumulative delta shows the net pressure that has built up across a session or move.
A steadily rising cumulative delta line means aggressive buyers have been in control throughout; a falling line means sellers have. Reading the line's slope gives you the trend of order flow, independent of exactly where price sits.
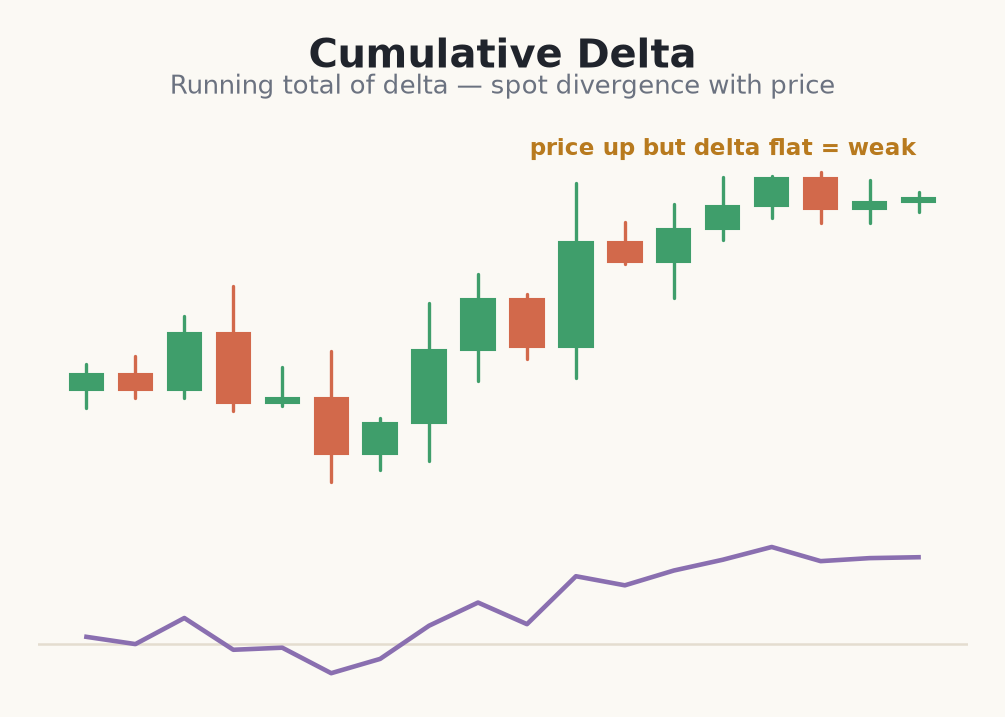
The divergence signal
The most watched pattern is divergence. If price makes a new high but cumulative delta makes a lower high, the new price high was not backed by fresh aggressive buying — a sign the move may be weak. The same in reverse warns of a hollow new low.
- Cumulative delta is the running total of per-bar delta.
- A rising line = net aggressive buying; a falling line = net selling.
- Price up but delta not confirming = bearish divergence.
- Price down but delta not confirming = bullish divergence.
Treat divergences as context, not triggers. Flow can diverge for a while before price responds, or not respond at all, and the same data caveats from the delta module apply on CFDs. Use cumulative delta to gauge the strength behind a trend and confirm with price before acting.
HOW to use it: mark the swing where price and the cumulative delta line last agreed, then watch the next test of that price. If price returns but cumulative delta cannot reclaim its old level, aggressive flow has quietly reversed — wait for a price trigger in that direction before you commit.
Trading a cumulative-delta divergence (€1000 account)
- 1Instrument: index CFD, price makes a new session high at 18,240.
- 2Cumulative delta at the first high was +4,200; at the new price high it only reads +2,600 — a lower high in flow.
- 3Read: price higher, flow lower = bearish divergence, the new high was not bought.
- 4Entry: short at 18,232 after a lower-high candle confirms the roll-over.
- 5Stop: 18,258, above the divergent high — a 26-point risk.
- 6Risk 1% of €1000 = €10. At €0.5 per point, size ≈ 0.77 units (€10 / (26 × €0.5)).
- 7Target: session VWAP at 18,180 = 52 points, about 2R, then trail the rest.
- 8If cumulative delta makes a fresh high instead, the divergence is void — no trade.
Cumulative delta mistakes that cost money
- Shorting the instant delta diverges — flow can lead price by many bars, so you need a price trigger too.
- Forgetting cumulative delta resets each session, then comparing today's line against yesterday's absolute level.
- Reading the line on a CFD that fakes delta from ticks and treating the divergence as gospel.
- Confusing a flat line for a bearish signal — no build-up just means balance, not a reversal.
- Holding a losing trade because 'delta still diverges' after price already invalidated the level.
Cumulative delta turns order flow into a trend line — and when it diverges from price, it hints the move is running on empty.