Smart Money Concepts (SMC) is a way of reading charts built on one idea: large institutions — banks, funds and market makers — trade in such size that they leave repeatable footprints in price. The framework, popularised through ICT (Inner Circle Trader) teachings, tries to explain moves through liquidity and order flow rather than lagging indicators. It is important to be clear from the start: this is a model of behaviour, not a proven fact about what any specific institution is doing on any given candle.
The central idea: markets need liquidity
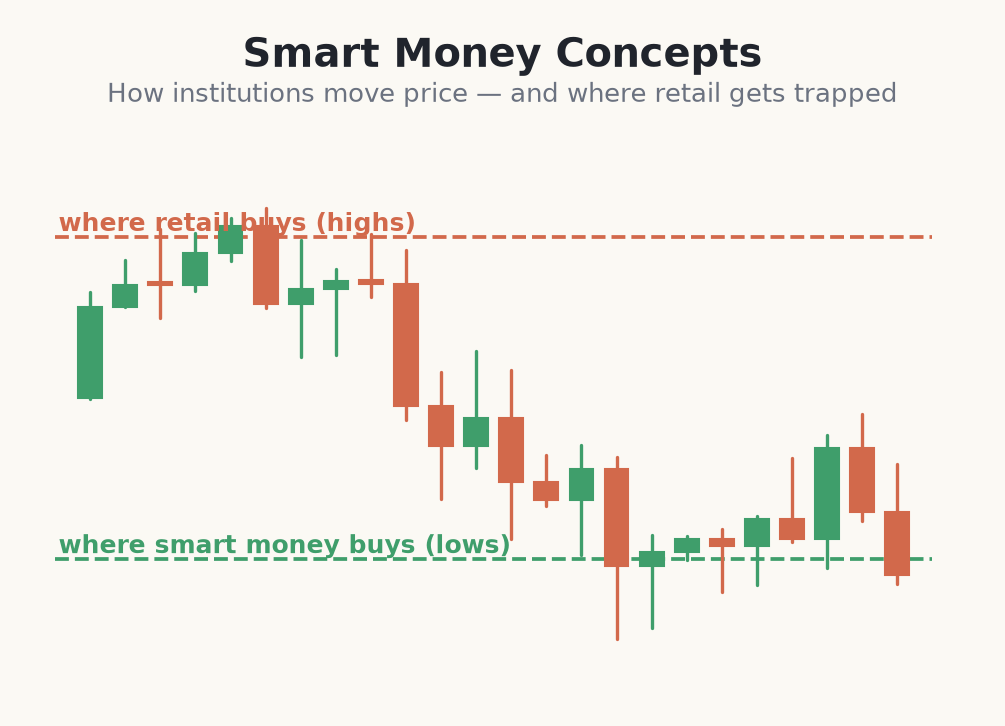
The story SMC tells is that big players need liquidity to fill large orders. A fund cannot buy a billion of anything at one price — it needs a crowd of sellers on the other side. The most reliable crowds of resting orders sit where retail stop losses and pending orders cluster: just above obvious highs and just below obvious lows. So price is often drawn toward those pools first, takes the orders, and only then moves in its intended direction. Whether this is deliberate engineering or simply how a market absorbs size, the pattern repeats often enough to trade around.
This reframes what a 'breakout' or a 'stop-out' even means. When price spikes above a high and instantly reverses, the SMC reading is not 'the breakout failed' — it is 'the breakout was the point: it collected the orders needed to fund the real move the other way'. Once you see charts through this lens, a lot of the moves that used to look random start to look like liquidity being harvested.
How SMC differs from classic price action
- <strong>Classic support/resistance</strong> asks: has price reacted here before? SMC asks: <strong>where are the orders</strong> that price will reach for next?
- A retail trader sees a clean double top as a place to sell the breakout. SMC sees the <strong>equal highs</strong> as a liquidity magnet price may run before turning.
- The vocabulary is different — BOS, CHoCH, order block, FVG, sweep — but underneath it is still just <strong>reading buyers versus sellers</strong>, one level deeper.
- It is a <strong>lens</strong>, not a religion. The best traders blend it with plain structure and risk control rather than treating every candle as a manipulation.
Staying honest about the hype
SMC and ICT attract enormous hype online, with promises of near-perfect entries. Treat every concept in this course as an interpretation of price, not a crystal ball. No concept wins every time, every edge must be backtested on your own market, and the same setup that looks obvious in hindsight was a coin-flip in real time. The people making money with SMC are winning on process and risk management, not on prediction.
Reading a chart the SMC way, step by step
- 1Open a bare EUR/USD 1-hour chart. Mark the last obvious swing high near 1.0910 and swing low near 1.0820 — these are your liquidity reference points.
- 2Ask the SMC question: where do stops rest? Short-seller stops and breakout buys sit above 1.0910; long stops and breakout sells sit below 1.0820.
- 3Watch which pool price reaches for. Price grinds up and wicks to 1.0918, taking the buy-side liquidity, then closes back below 1.0910 — a classic run-and-reject.
- 4Now bias flips: with buy-side liquidity taken, you look for a move down toward the sell-side pool at 1.0820. That is your working hypothesis, not a certainty.
- 5Everything after this — structure shift, order block, FVG entry — is just refining that idea into a trade with a defined stop. The liquidity read came first.
Common beginner mistakes with SMC
- Treating SMC as a secret that always works. It is a probabilistic model. The 'smart money always wins' framing sells courses; it does not survive a real backtest.
- Seeing manipulation in every candle. Most moves are just ordinary supply and demand. Reserve the SMC labels for clean, obvious liquidity events, not every wick.
- Skipping structure and risk to chase the narrative. A pretty story about institutions is worthless without a stop. The story tells you direction; risk management keeps you alive when it is wrong.
- Collecting concepts instead of a process. Knowing 20 SMC terms is not an edge. One simple, tested sequence you run the same way every time is worth more than all the vocabulary.
Smart Money Concepts read the chart as a liquidity game — a useful model to backtest and combine with risk management, never a guaranteed edge.